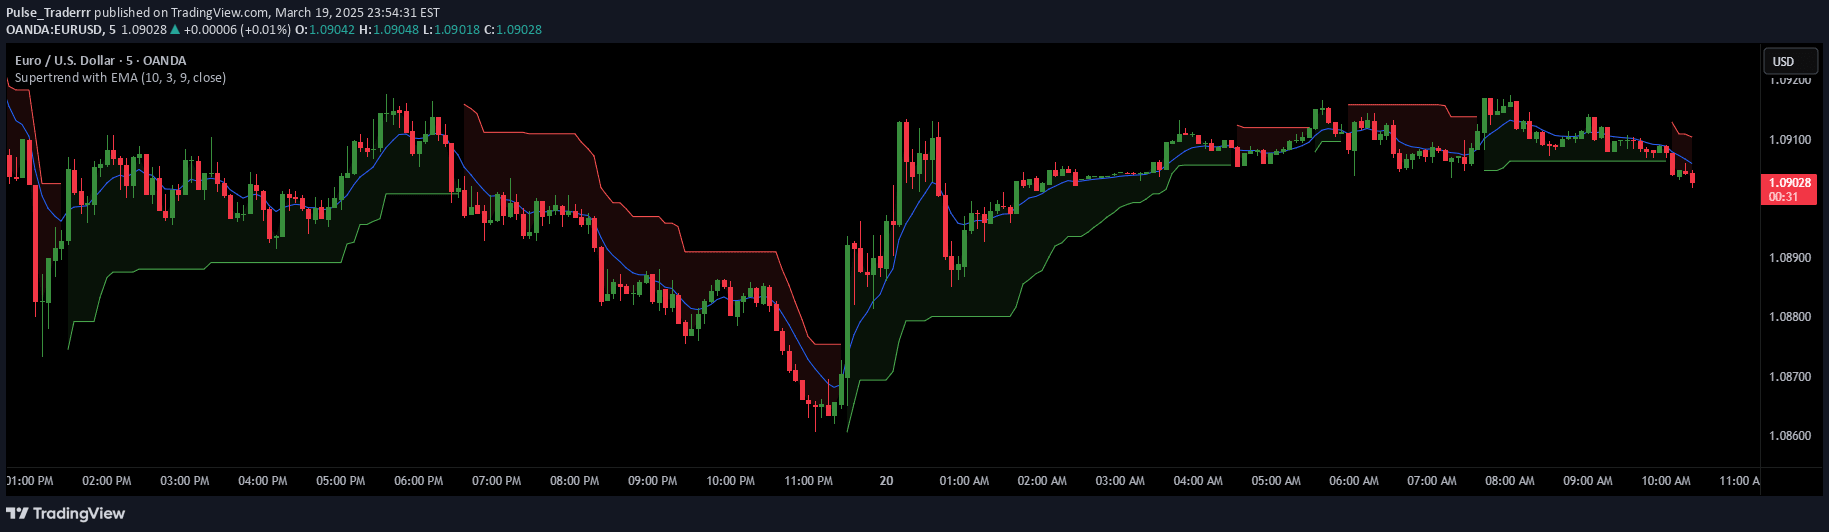
SUPeR TReND 2.718 is an advanced Supertrend indicator using Euler's constant, providing precise trend detection with dynamic visual layers and customizable trend tracking.
Explore complementary indicator rolesHow it works
The SUPeR TReND 2.718 uses Average True Range (ATR) with a unique multiplier of 2.718 to calculate trend direction. It plots a dynamic line above or below price, indicating trend support or resistance. The indicator incorporates color-coded candles and optional fill to enhance visual trend representation.
A trend duration tally tracks how long the current trend persists. The system can overlay multiple timeframe trends, allowing traders to compare different trend perspectives simultaneously. Its modular design enables quick customization of volatility parameters and visual elements
Why it may be useful
This advanced Supertrend variant provides traders with a sophisticated, visually intuitive trend detection tool. By leveraging Euler's constant, it offers more nuanced trend analysis compared to traditional implementations. The multi-timeframe overlay helps traders understand trend dynamics across different periods.
Color-coded elements and transparent fills make trend identification more immediate and less cognitively demanding. The trend duration tally allows quick assessment of trend strength and potential exhaustion points. Its flexible design supports various trading styles and can be integrated into complex trading systems
When to explore it
SUPeR TReND 2.718 performs best on 1-hour and daily charts for swing and trend-following strategies. It excels in markets with clear directional movements, such as forex, cryptocurrencies, and major stock indices. Traders should use it alongside volume or liquidity indicators for enhanced confirmation.
The HTF trend line is particularly useful for filtering trade entries and understanding macro market bias. It works well in trending markets and can help identify potential pullback entry zones. Most effective when combined with other technical analysis tools for comprehensive market analysis
Keep exploring
What we’ve verified
Access, alerts and repainting behaviour have not been independently verified for this indicator. Check the creator’s current publication and settings.
General descriptions and classifications are recovered research. Verified details above identify the specific checks we have completed. Check the creator’s current publication for later changes.