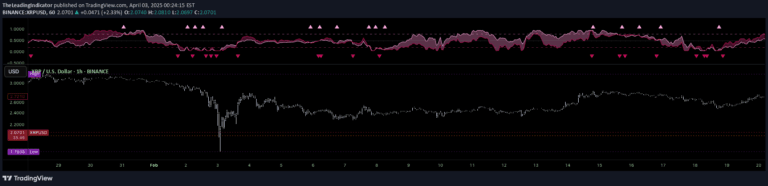
Gold/Silver Ratio tracking tool that reveals market structure and potential trade opportunities by comparing gold and silver price dynamics using percentile bands and moving averages.
Explore complementary indicator rolesHow it works
The Silver Lining tool calculates the Gold/Silver Ratio by dividing gold price by silver price and comparing it against a moving average (VWMA or EMA). It generates color-coded signals based on the ratio's position relative to percentile bands (20th, 50th, 80th). When the ratio moves through these bands, it indicates potential shifts in market sentiment and trading opportunities for silver and gold markets
Why it may be useful
This indicator provides traders with a unique perspective on market dynamics by revealing structural dominance and potential trend reversals. It helps traders identify precise entry and exit points by mapping macro relative strength flow. The tool transforms complex market relationships into actionable trading insights, enabling more informed decision-making across digital silver and gold markets
When to explore it
The Silver Lining works best on lower timeframes like 15-minute and 1-hour charts, where market movements are more responsive. It is particularly effective when silver is testing support levels and when used in conjunction with trend confirmation systems. Traders should pay special attention when the Gold/Silver Ratio rotates through percentile bands, signaling potential market regime changes
Keep exploring
What we’ve verified
Access, alerts and repainting behaviour have not been independently verified for this indicator. Check the creator’s current publication and settings.
General descriptions and classifications are recovered research. Verified details above identify the specific checks we have completed. Check the creator’s current publication for later changes.