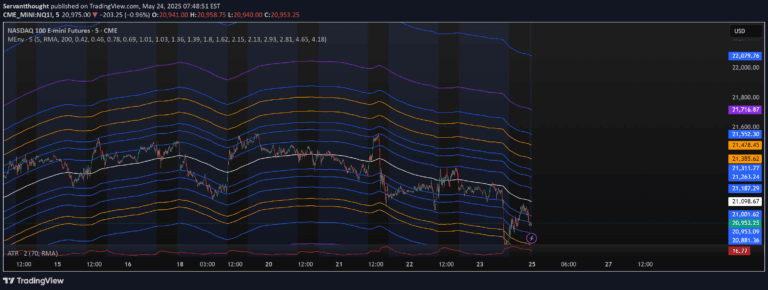
A dynamic volatility indicator using median price and standard deviation bands to analyze market trends, identifying potential support, resistance, and trend reversals with customizable settings.
Explore complementary indicator rolesHow it works
The Median Deviation Bands indicator calculates a median baseline using the 50th percentile of price data over a user-defined period, typically 50 periods. This baseline serves as a central reference point for trend analysis, with price movements above or below this line indicating bullish or bearish trends respectively.
The indicator then plots three sets of upper and lower bands representing 1x, 2x, and 3x standard deviations from the median. These dynamic bands act as flexible support and resistance zones, helping traders visualize market volatility and potential price reversal points with increasing levels of deviation significance.
Why it may be useful
The Median Deviation Bands provide traders with a comprehensive view of market volatility and price behavior, offering insights beyond traditional trend indicators. By integrating percentile-based median calculations with standard deviation bands, traders can more accurately assess market conditions and potential trend movements.
This approach allows for a nuanced understanding of price dynamics, helping traders identify potential entry and exit points with greater precision. The indicator's ability to adapt to changing market conditions makes it a versatile tool for analyzing price movements across different market environments and trading strategies.
When to explore it
The Median Deviation Bands are most effective in markets with clear trending characteristics, where price movements show consistent directional momentum. Traders can utilize this indicator during periods of moderate to high volatility, where price tends to oscillate around a central baseline with identifiable trend patterns.
The indicator is particularly useful for traders seeking to implement trend-following or mean reversion strategies, as it provides clear visual cues about potential trend reversals and market extremes. It works best when combined with other technical analysis tools to confirm signals and validate potential trading opportunities.
Keep exploring
What we’ve verified
Access, alerts and repainting behaviour have not been independently verified for this indicator. Check the creator’s current publication and settings.
General descriptions and classifications are recovered research. Verified details above identify the specific checks we have completed. Check the creator’s current publication for later changes.