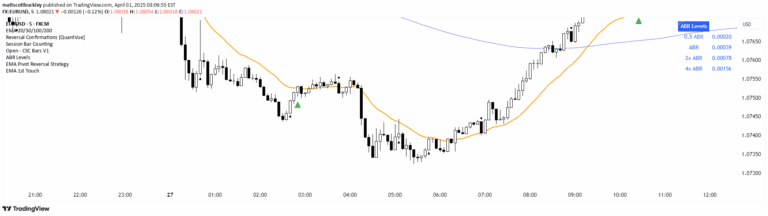
A unique indicator combining median smoothing and standard deviation to detect market trends and volatility, offering enhanced sensitivity while filtering out short-term price noise.
Explore complementary indicator rolesHow it works
The Median Standard Deviation indicator uses a Double Exponential Moving Average (DEMA) to initially smooth price data over a specified period, reducing market noise and capturing broader price trends. This smoothed data is then processed through a median calculation to extract the central price tendency, creating a more stable baseline for analysis.
Subsequently, the indicator calculates Average True Range (ATR) and standard deviation to establish dynamic upper and lower trend bands. These bands help traders identify potential price movement boundaries by measuring market volatility, with the ATR multiplier and standard deviation length allowing for customizable sensitivity to market conditions.
Why it may be useful
Traditional trend indicators often struggle with market volatility, producing false signals that can lead to poor trading decisions. The Median Standard Deviation overcomes this limitation by integrating multiple statistical techniques, providing traders with a more nuanced and accurate view of market dynamics that reduces the impact of short-term price fluctuations.
By combining median smoothing, ATR, and standard deviation, this indicator offers a comprehensive approach to trend analysis that adapts to changing market conditions. Traders gain enhanced insights into potential price movements, enabling more informed and strategic trading decisions across different market environments.
When to explore it
The Median Standard Deviation indicator is most effective in volatile markets where traditional trend-following methods might generate misleading signals. Its sophisticated calculation method makes it particularly valuable during periods of significant price uncertainty, helping traders distinguish between genuine trend movements and temporary market noise.
Traders should consider using this indicator when seeking a robust, adaptable tool for trend detection across various timeframes. It is especially useful for those wanting to minimize whipsaws and false signals, making it suitable for strategies that require precise entry and exit points in both trending and ranging market conditions.
Keep exploring
What we’ve verified
Access, alerts and repainting behaviour have not been independently verified for this indicator. Check the creator’s current publication and settings.
General descriptions and classifications are recovered research. Verified details above identify the specific checks we have completed. Check the creator’s current publication for later changes.