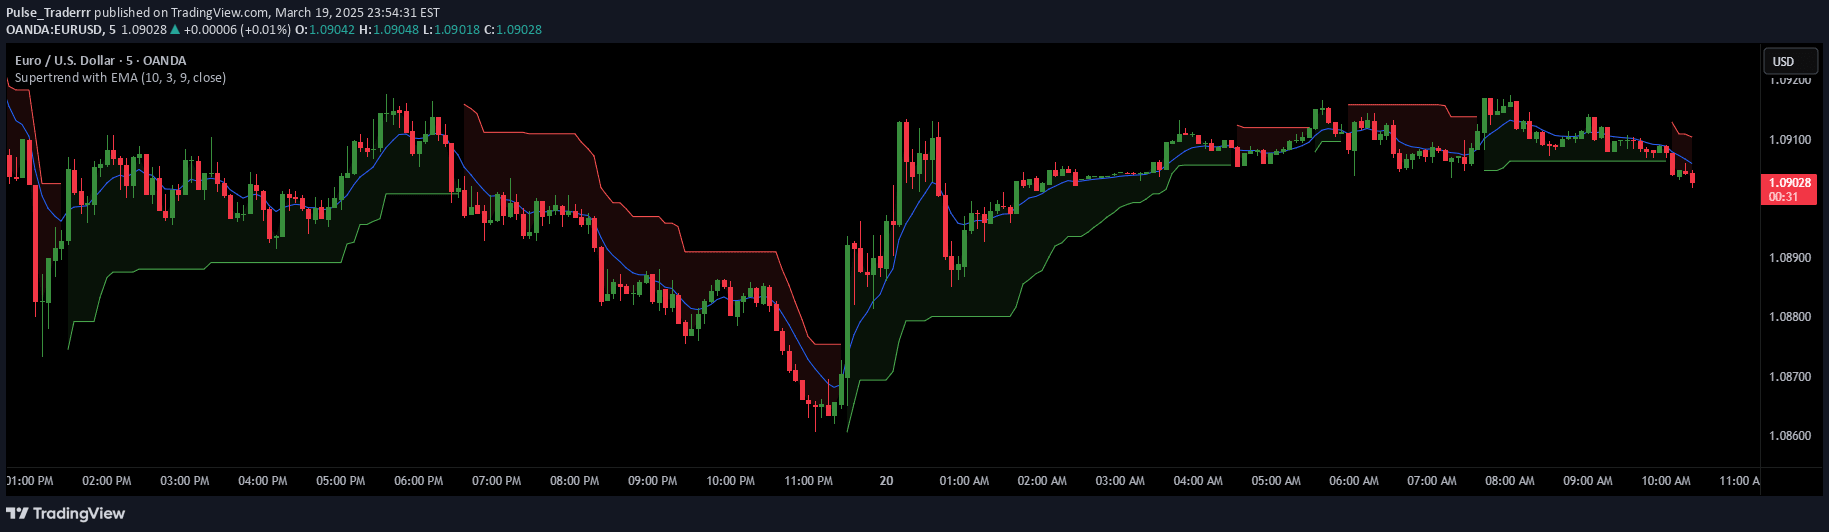
Dema Supertrend combines Double Exponential Moving Average with Supertrend to provide a responsive trend detection tool that adapts to market volatility and reduces signal lag.
Explore complementary indicator rolesHow it works
The Dema Supertrend integrates Double Exponential Moving Average (DEMA) with the Supertrend method to create a sophisticated trend identification tool. It calculates DEMA using smoothed price data over a specified length, which helps minimize lag and capture more responsive trend movements.
The indicator then applies Average True Range (ATR) to create dynamic upper and lower bands around the DEMA value. These bands adjust dynamically to market volatility, signaling trend direction by tracking whether price moves above or below these adaptive bands, effectively providing clear visual cues for potential trend changes.
Why it may be useful
The Dema Supertrend offers traders a more precise method of trend detection by reducing the noise typically associated with traditional moving average indicators. By combining DEMA's lag reduction with Supertrend's volatility adaptation, traders gain a more reliable tool for identifying market direction with enhanced accuracy.
This approach provides traders with a comprehensive view of market movements, allowing for more informed decision-making. The indicator's ability to adapt to changing market conditions makes it particularly valuable for traders seeking a dynamic and responsive trend analysis tool that can perform effectively across different market environments.
When to explore it
The Dema Supertrend is most effective in markets experiencing clear trending conditions, where price movements show consistent directional momentum. It performs exceptionally well in volatile markets where traditional indicators might generate multiple false signals or lag behind price action.
Traders should utilize this indicator when seeking to confirm trend strength, manage entry and exit points, and reduce the impact of market noise. It is particularly useful in liquid markets with sufficient price movement, such as forex, cryptocurrencies, and major stock indices, where its adaptive nature can provide meaningful insights into market dynamics.
Keep exploring
What we’ve verified
Access, alerts and repainting behaviour have not been independently verified for this indicator. Check the creator’s current publication and settings.
General descriptions and classifications are recovered research. Verified details above identify the specific checks we have completed. Check the creator’s current publication for later changes.