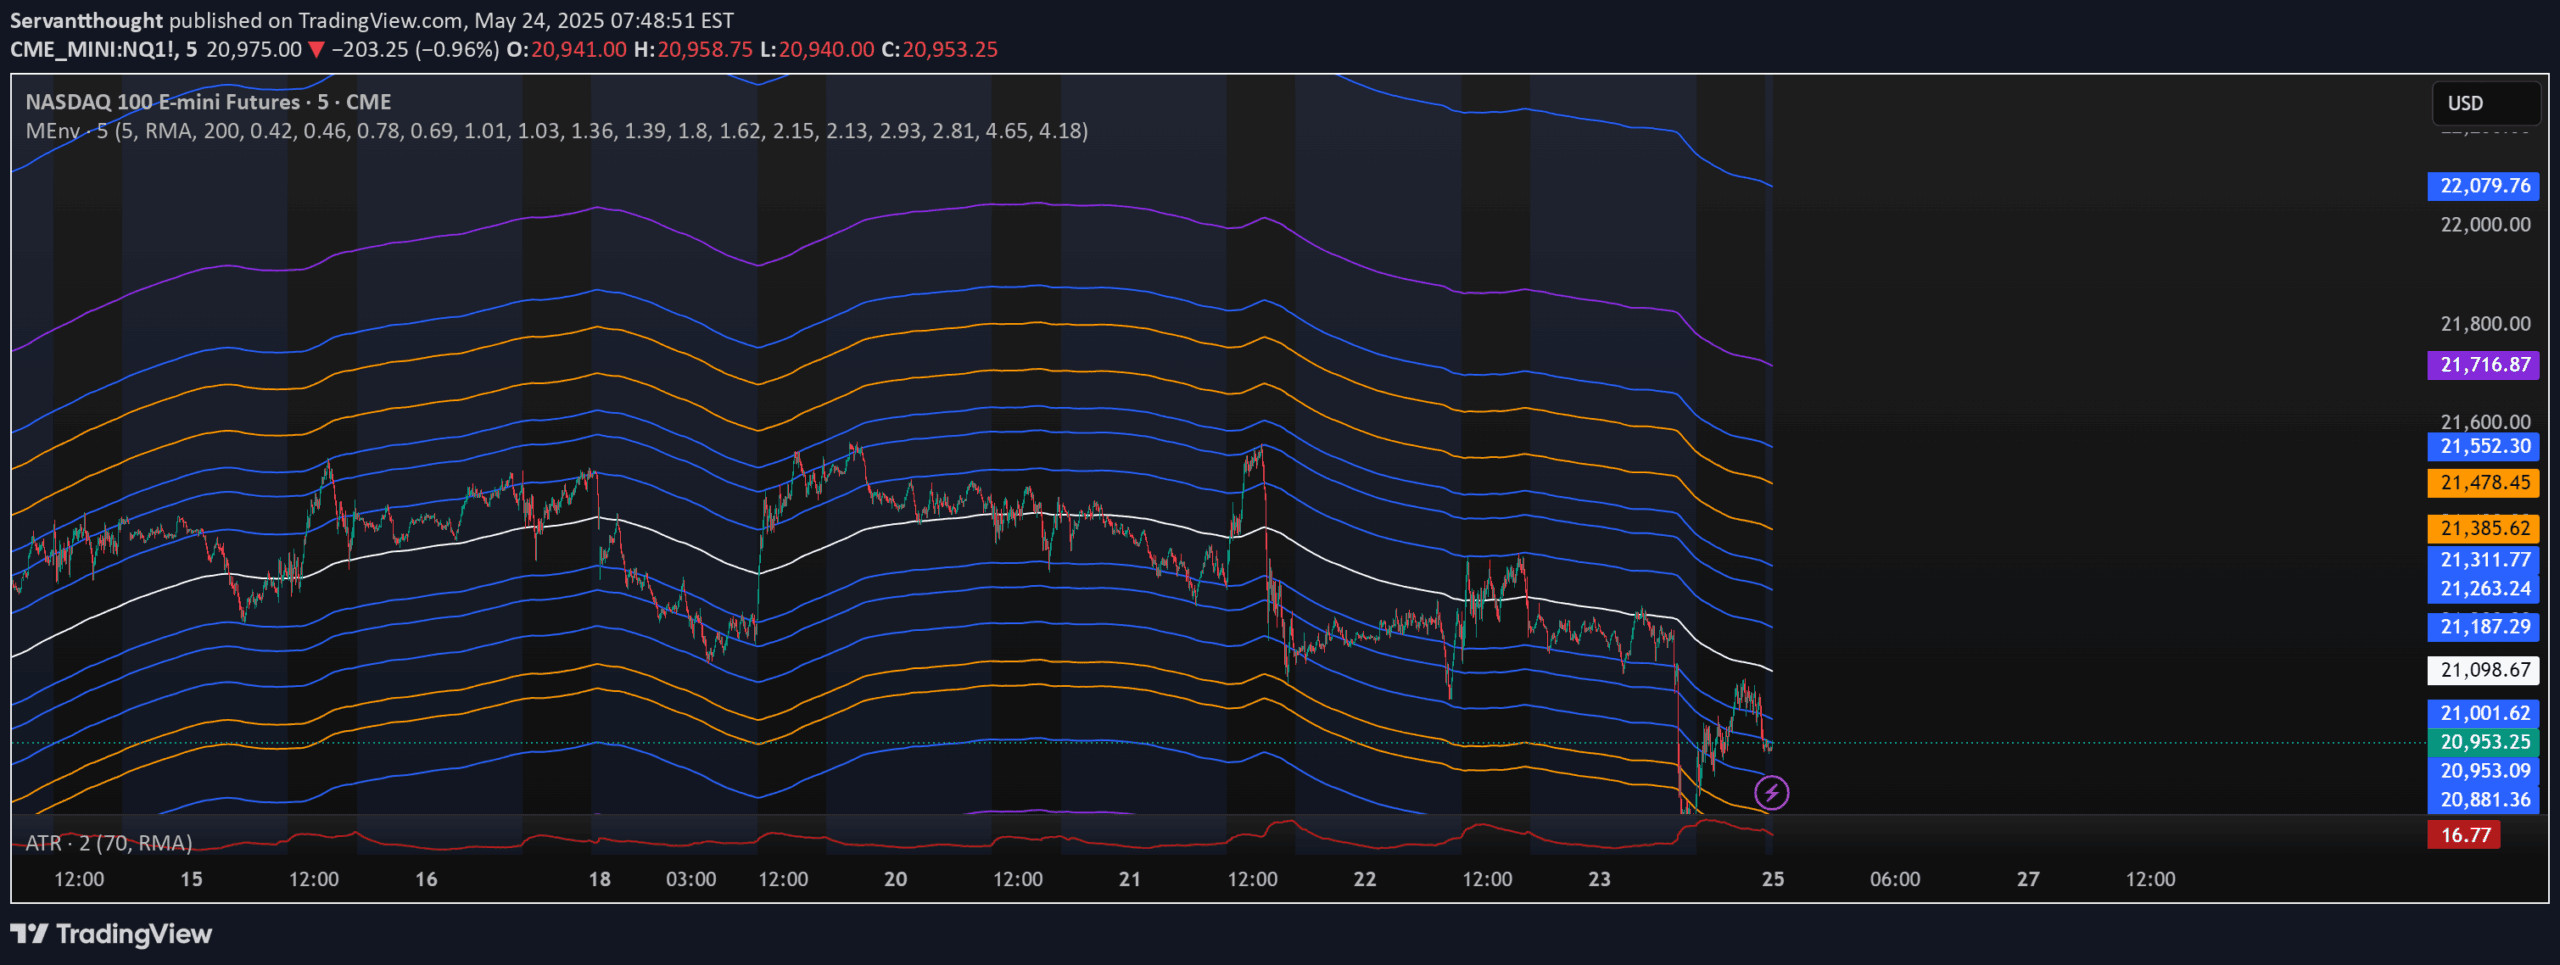
A multi-envelope technical analysis indicator using a 200-period RMA with eight customizable bands to help identify market support, resistance, and potential trend boundaries.
Explore complementary indicator rolesHow it works
The RMA Multi-Envelope Indicator generates eight distinct envelope bands around a 200-period Running Moving Average (RMA) using independent upper and lower percentage deviations. Each band is preset with specific percentage ranges, creating a layered visual representation of potential price movement zones, with the basis line serving as a central reference point.
The indicator allows users to customize the timeframe, moving average type, length, and band colors, providing flexibility in analyzing different market conditions. By adjusting these parameters, traders can fine-tune the indicator to match specific trading strategies and asset characteristics.
Why it may be useful
This indicator provides a comprehensive view of potential price support and resistance levels, helping traders identify market dynamics with greater precision. By creating multiple envelope bands, it offers a nuanced perspective on price movement, allowing traders to recognize potential trend boundaries and market sentiment more effectively.
The customizable nature of the RMA Multi-Envelope Indicator enables traders to adapt the tool to various market conditions and trading styles. Its visual representation helps traders quickly assess potential entry and exit points, reducing the complexity of market analysis and supporting more informed trading decisions.
When to explore it
The RMA Multi-Envelope Indicator is most effective in markets with clear trending characteristics, particularly on 5-minute charts where short-term price movements are more pronounced. It works best in liquid markets with consistent price action, such as major forex pairs, stock indices, and high-volume commodities.
Traders should use this indicator in conjunction with other technical analysis tools to confirm signals and reduce false positives. It is particularly useful during periods of moderate volatility, where the multiple envelope bands can provide clear insights into potential price support and resistance levels.
Keep exploring
What we’ve verified
Access, alerts and repainting behaviour have not been independently verified for this indicator. Check the creator’s current publication and settings.
General descriptions and classifications are recovered research. Verified details above identify the specific checks we have completed. Check the creator’s current publication for later changes.