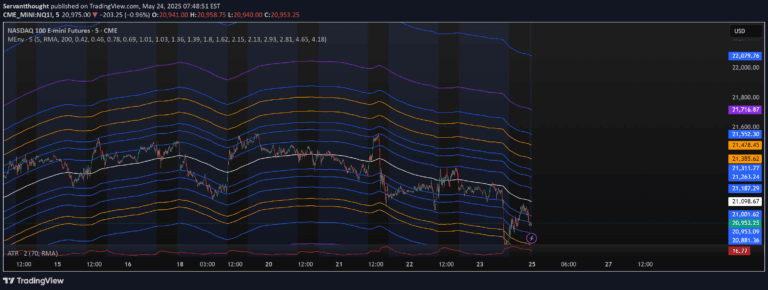
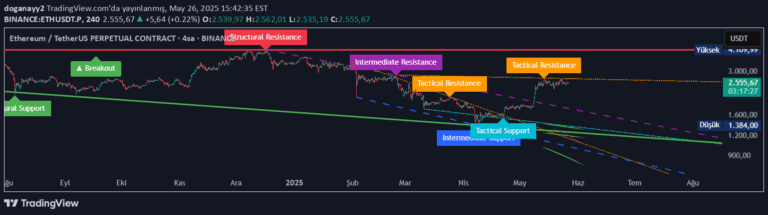
A multi-timeframe indicator that plots dynamic support bands across different time horizons, helping traders identify potential price bounce areas and market direction.
Explore complementary indicator rolesHow it works
The Multi Timeframe Bull Market Support Bands (BMSB) indicator calculates support levels using moving averages across multiple timeframes, from 5 minutes to weekly charts. Each timeframe generates its own support band, with shorter timeframe bands conditionally displayed based on the current chart's time horizon.
As new bands form, they are highlighted to indicate their first appearance, acting as potential price magnets. Traders can customize the moving average periods to suit their specific trading strategy, ensuring consistency across all timeframe bands and providing a comprehensive view of potential support levels.
Why it may be useful
The BMSB indicator offers traders a sophisticated method of understanding market dynamics by revealing support levels across different time perspectives simultaneously. By visualizing how price interacts with these dynamic bands, traders gain insights into potential bounce areas and market trends that might not be apparent on a single timeframe.
This multi-layered approach enhances decision-making by providing a more comprehensive market view. Traders can anticipate potential price movements, identify key support zones, and develop more nuanced trading strategies based on the interplay between different timeframe support bands.
When to explore it
The Multi Timeframe Bull Market Support Bands indicator is most effective in trending markets with clear directional movement, where support levels play a crucial role in price action. It works particularly well when traders want to understand the broader market context and identify potential entry or exit points across different trading timeframes.
Traders should leverage this indicator during periods of market volatility, when price is likely to interact with support bands in meaningful ways. It is especially useful for those employing strategies that require a comprehensive view of market dynamics, such as trend-following or swing trading approaches.
Keep exploring
What we’ve verified
Access, alerts and repainting behaviour have not been independently verified for this indicator. Check the creator’s current publication and settings.
General descriptions and classifications are recovered research. Verified details above identify the specific checks we have completed. Check the creator’s current publication for later changes.