
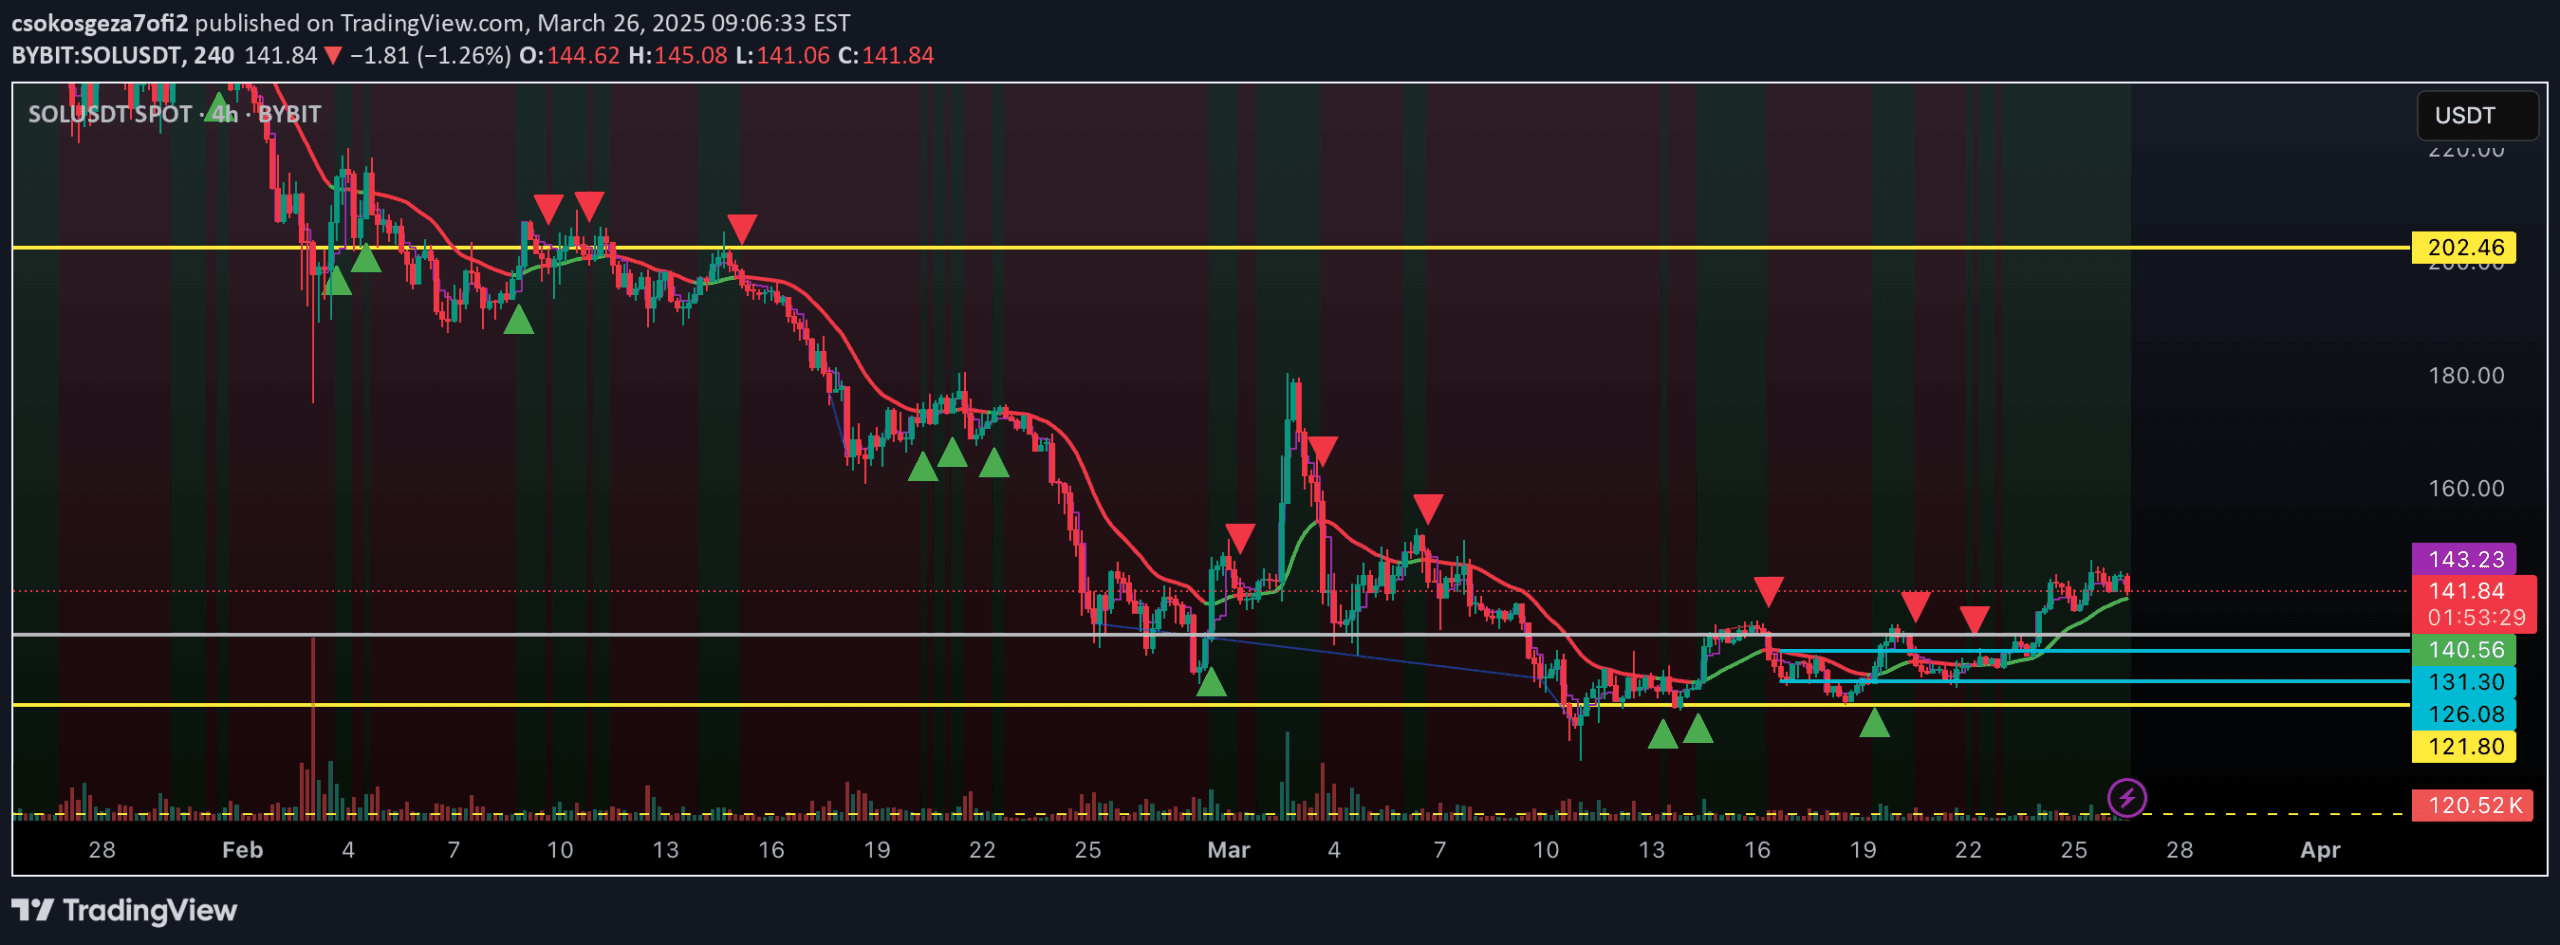
A dynamic trend-following indicator that combines a flexible moving average with volume-weighted average price to identify market trends while minimizing false signals in choppy markets.
Explore complementary indicator rolesHow it works
The Dynamic Trend Indicator (DTI) calculates a custom Exponential Moving Average (EMA) with a dynamically adjusted period based on market volatility and trend strength. It uses Average True Range (ATR) to measure volatility and price momentum to determine trend intensity.
The EMA period shortens during strong trends for faster responsiveness and lengthens during weak markets to reduce noise. A daily Volume Weighted Average Price (VWAP) filter confirms trend direction, and a cooldown mechanism prevents rapid signal reversals
Why it may be useful
This indicator helps traders identify and follow market trends more accurately by adapting to changing market conditions. By dynamically adjusting its sensitivity, it reduces false signals common in traditional trend-following methods.
The VWAP filter adds an institutional-level confirmation by integrating volume-weighted price information. The cooldown mechanism further improves signal reliability by preventing overtrading in choppy markets, making it a sophisticated tool for traders seeking more precise trend identification
When to explore it
The DTI works best in trending markets with clear directional movement, particularly in forex, cryptocurrency, and stock markets. It is most effective on intraday timeframes like 1-hour and 4-hour charts where daily trend information provides meaningful context.
Traders should use this indicator when seeking to align trades with the broader market trend, avoid false signals, and capture sustained price movements. It is particularly useful during periods of moderate to high market volatility
Keep exploring
What we’ve verified
Access, alerts and repainting behaviour have not been independently verified for this indicator. Check the creator’s current publication and settings.
General descriptions and classifications are recovered research. Verified details above identify the specific checks we have completed. Check the creator’s current publication for later changes.


