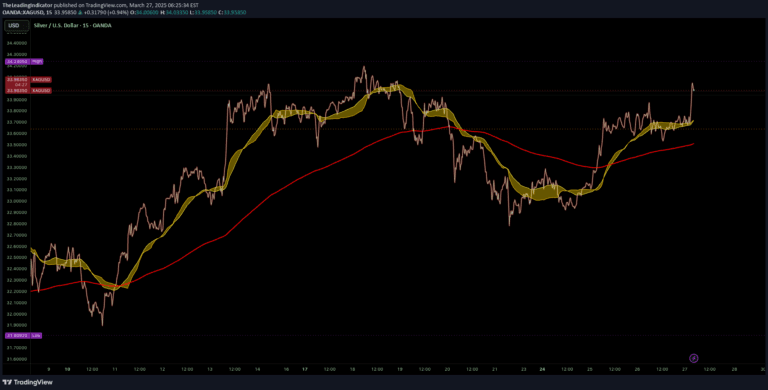
A scalping indicator for gold trading that uses SMA, daily price levels, and RSI to generate buy and sell signals across short-term timeframes.
Explore complementary indicator rolesHow it works
The Gold Scalper indicator analyzes short-term price movements by calculating the previous day's high and low prices and tracking the Simple Moving Average (SMA). It identifies potential trading opportunities through breakout conditions, specifically when the SMA crosses above yesterday's high or below yesterday's low.
The indicator incorporates two RSI calculations: the Banker RSI and Hot Money RSI, which help assess market momentum and generate precise entry and exit signals. These calculations are combined with user-configurable settings like timeframe resolution and SMA period to create a flexible trading tool for gold market scalping.
Why it may be useful
This indicator provides traders with a systematic approach to identifying short-term trading opportunities in the gold market, reducing emotional decision-making and offering structured entry and exit points. By combining multiple technical analysis techniques like SMA, daily price levels, and RSI, it offers a comprehensive view of potential market movements.
The signal's strength lies in its ability to quickly adapt to changing market conditions, providing traders with real-time insights into potential trend reversals and momentum shifts. Its customizable nature allows traders to fine-tune the indicator to match their specific trading style and risk tolerance.
When to explore it
The Gold Scalper indicator is most effective during periods of high gold market volatility, particularly during active trading hours when price movements are most pronounced. It is especially useful for traders focusing on short-term, high-frequency trading strategies in the gold market.
Traders should use this indicator when seeking rapid, precise entry and exit points, and when they want to capitalize on quick price fluctuations. It is particularly beneficial for those trading on 1-minute or 30-second timeframes, where quick decision-making and momentum analysis are crucial.
Keep exploring
What we’ve verified
Access, alerts and repainting behaviour have not been independently verified for this indicator. Check the creator’s current publication and settings.
General descriptions and classifications are recovered research. Verified details above identify the specific checks we have completed. Check the creator’s current publication for later changes.