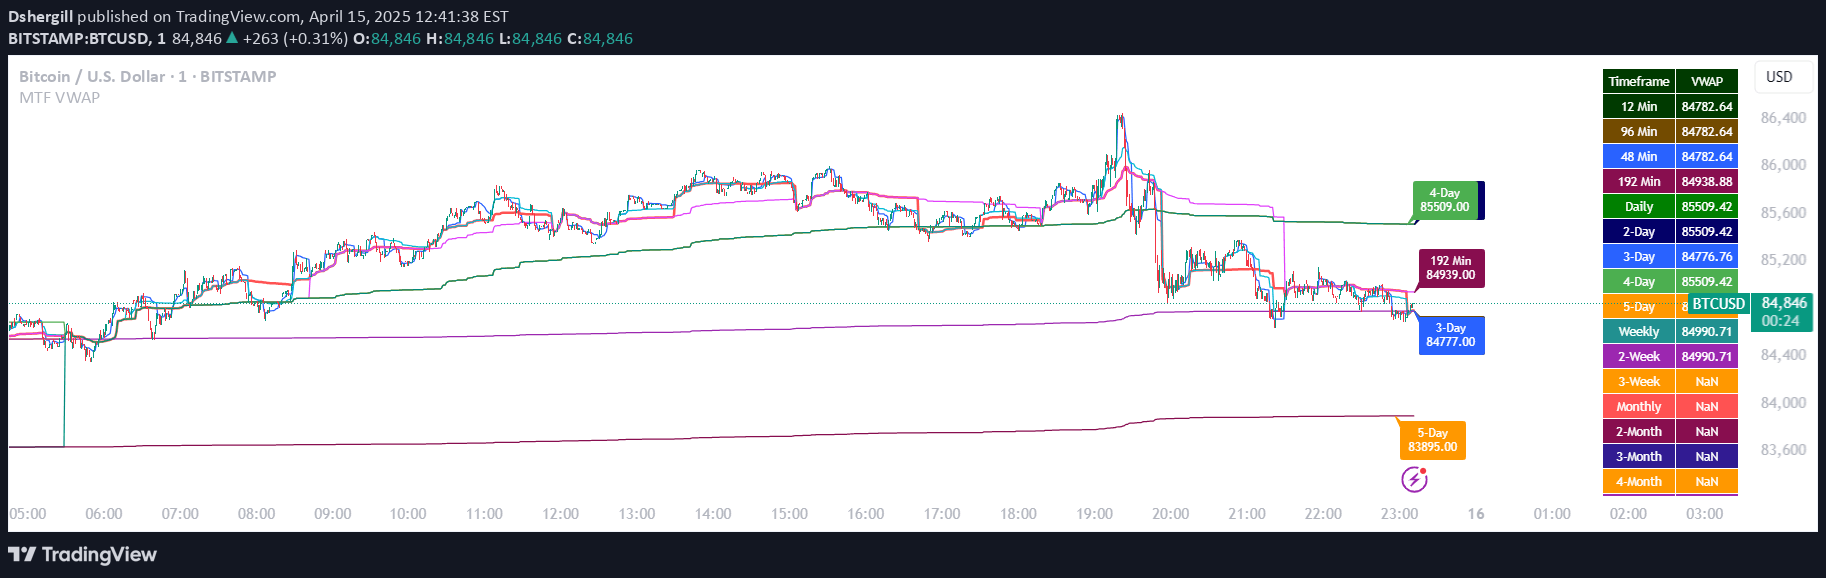
A multi-timeframe EMA indicator that overlays 1-hour, 4-hour, and daily exponential moving averages to provide comprehensive price momentum and trend analysis across different trading intervals.
Explore complementary indicator rolesHow it works
The indicator calculates and plots multiple Exponential Moving Averages (EMAs) across three distinct timeframes: 1-hour, 4-hour, and daily charts. On the 1-hour timeframe, it tracks EMA 13 and EMA 21 to capture rapid price changes and short-term momentum shifts. The 4-hour EMA 21 provides a more stable intermediate perspective, filtering out minor price fluctuations.
In the daily timeframe, the indicator plots EMAs at 13, 25, and 50 periods to highlight longer-term market trends and overall sentiment. By simultaneously displaying these EMAs, traders can visually compare and analyze price movement across different time horizons, enabling a more comprehensive understanding of market dynamics and potential trend confirmations.
Why it may be useful
Multi-timeframe EMA analysis is crucial for traders seeking a holistic view of market momentum and trend strength. By integrating short, medium, and long-term moving averages, traders can make more informed decisions that balance immediate price action with broader market trends. This approach helps minimize the risk of trading against the prevailing market direction and provides a more nuanced understanding of potential entry and exit points.
The indicator's comprehensive design allows traders to identify confluences and divergences across different timeframes, which can signal potential trend reversals or continuations. This method is particularly valuable for traders who want to align their trading strategies with multiple time horizon perspectives, reducing the likelihood of making impulsive or contradictory trading decisions.
When to explore it
This multi-timeframe EMA indicator is most effective during periods of clear market trends, whether bullish or bearish. Traders should prioritize using this tool in markets with consistent directional movement, where the different EMAs can provide clear signals of trend strength and potential momentum shifts. It is particularly useful in highly liquid markets with sufficient price data to generate meaningful moving average calculations.
The indicator works best when combined with other technical analysis tools and fundamental market research. Traders should pay special attention to instances where shorter-term and longer-term EMAs align, as these confluences can indicate strong trading opportunities. It is especially valuable for swing and position traders who require a comprehensive view of market dynamics before making trading decisions.
Keep exploring
What we’ve verified
Access, alerts and repainting behaviour have not been independently verified for this indicator. Check the creator’s current publication and settings.
General descriptions and classifications are recovered research. Verified details above identify the specific checks we have completed. Check the creator’s current publication for later changes.