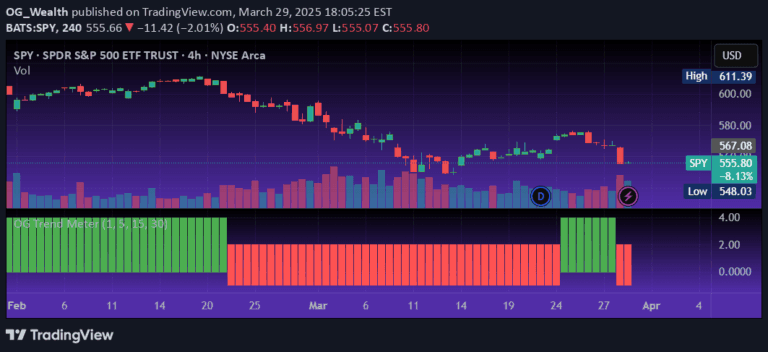
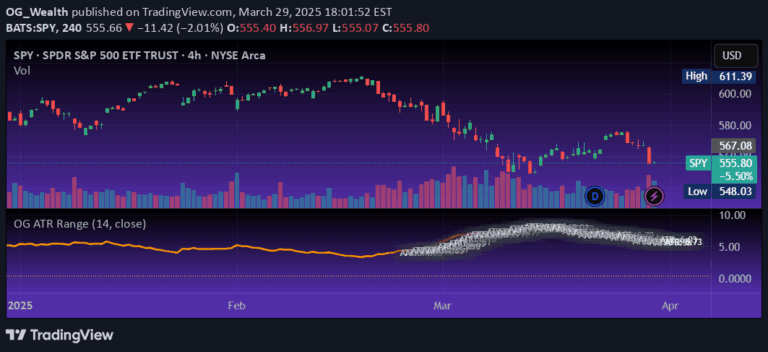
A trading signal combining Stochastic Oscillator and RSI to analyze market momentum and identify potential trend reversals by comparing their dynamic thresholds.
Explore complementary indicator rolesHow it works
The signal begins by calculating the Stochastic Oscillator's %K and %D lines, applying a smoothing mechanism to create a more refined momentum indicator. It simultaneously computes the Relative Strength Index (RSI) by comparing average gains and losses over a specified period. The script then integrates these two indicators, comparing their values against dynamic thresholds to detect potential market shifts.
When the smoothed Stochastic %K line and RSI interact in specific ways, the indicator generates trading signals. These interactions can include crossovers, where one indicator crosses above or below the other, signaling potential changes in market sentiment and momentum. The smoothing and dynamic threshold approach helps reduce false signals and provides a more nuanced view of market conditions.
Why it may be useful
This trading signal offers traders a comprehensive approach to market analysis by combining two powerful momentum indicators. By integrating the Stochastic Oscillator and RSI, traders gain a more robust method of identifying potential trend reversals and market sentiment shifts. The signal provides multiple layers of confirmation, reducing the likelihood of making trades based on isolated or misleading indicators.
The innovative approach of comparing these indicators against dynamic thresholds allows traders to make more informed decisions. It helps in understanding not just price movement, but the underlying momentum and strength behind those movements. This multi-dimensional analysis can potentially improve trade entry and exit timing, offering traders a more sophisticated tool for market interpretation.
When to explore it
The signal is most effective in markets with clear momentum and defined trending or ranging conditions. It works particularly well in liquid markets with consistent price movements, such as major forex pairs, stock indices, and large-cap stocks. Traders should ideally use this signal in timeframes ranging from short-term (minutes) to medium-term (daily) charts for optimal results.
The indicator is especially useful during periods of market transition, where momentum is changing and traders need to identify potential trend reversals. It can be particularly valuable during key economic events, earnings releases, or periods of significant market volatility. Traders should combine this signal with other technical and fundamental analysis tools to enhance its predictive capabilities and confirm potential trading opportunities.
Keep exploring
What we’ve verified
Access, alerts and repainting behaviour have not been independently verified for this indicator. Check the creator’s current publication and settings.
General descriptions and classifications are recovered research. Verified details above identify the specific checks we have completed. Check the creator’s current publication for later changes.