
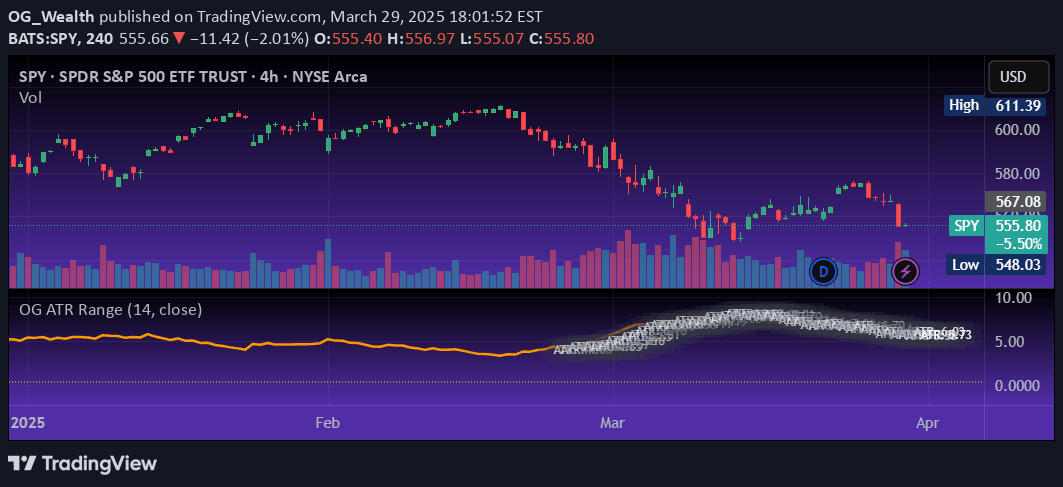
The OG ATR Tool is a volatility indicator that calculates average price range to help traders identify market movement potential, set stop-losses, and develop realistic trading strategies.
Explore complementary indicator rolesHow it works
The Average True Range (ATR) indicator measures market volatility by calculating the average range of recent price movements. It analyzes the maximum distance between high and low prices, accounting for price gaps and market changes. The tool computes average price fluctuations over a specified period, typically using 14 candles as a standard timeframe.
By tracking these price ranges, traders can understand the instrument's typical movement patterns. The ATR generates a single value representing average volatility, which helps in understanding potential price expansion or contraction. Traders can use this value to make informed decisions about trade entries and exits
Why it may be useful
Understanding market volatility is crucial for effective trading risk management. The ATR provides traders with a clear, quantitative measure of price movement potential. It helps set realistic profit targets and stop-loss levels based on actual market behavior. By knowing an instrument's typical price range, traders can avoid placing unrealistic orders that might get stopped out prematurely.
The indicator allows for dynamic position sizing and helps traders adapt their strategies to changing market conditions. It provides insights into market sentiment and potential price breakouts. ATR is particularly valuable for managing risk in volatile or unpredictable market environments
When to explore it
The ATR is most effective during periods of changing market volatility. It works exceptionally well for traders seeking to understand price movement potential before entering trades. Day traders can use it to set intraday stop-loss levels and determine appropriate position sizes. Swing traders benefit from using ATR to identify potential trend strength and market conditions.
It's particularly useful during market transitions, such as moving from low to high volatility periods. Traders should combine ATR with trend indicators for more comprehensive market analysis. The tool is valuable across various financial instruments, including stocks, forex, commodities, and cryptocurrencies
Keep exploring
What we’ve verified
Access, alerts and repainting behaviour have not been independently verified for this indicator. Check the creator’s current publication and settings.
General descriptions and classifications are recovered research. Verified details above identify the specific checks we have completed. Check the creator’s current publication for later changes.


