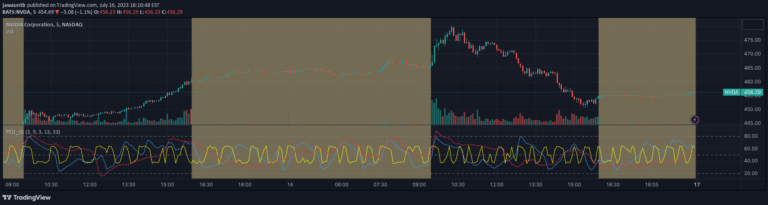
A custom technical indicator that measures volatility momentum by applying RSI calculation principles to Average True Range values, tracking the speed and magnitude of volatility changes.
Explore complementary indicator rolesHow it works
The ATR Strength Index calculates volatility momentum by tracking period-over-period changes in Average True Range (ATR) values. It follows a similar methodology to the Relative Strength Index (RSI), separating ATR gains and losses and smoothing them over a specified lookback period.
The indicator then computes an ATR Relative Strength (ATR RS) by comparing smoothed average ATR gains and losses. This value is transformed into an oscillator that ranges from 0 to 100, providing a quantitative representation of volatility momentum's direction and speed.
Why it may be useful
The ATR Strength Index offers traders a unique perspective on market dynamics by measuring volatility momentum, which traditional indicators cannot capture. It provides insights into how quickly market choppiness or range is expanding or contracting, helping traders understand underlying market conditions beyond simple price movement.
By revealing the speed of volatility changes, this indicator helps traders adapt their strategies to evolving market environments. It can signal potential transitions between low and high volatility periods, enabling more informed decision-making about trade entry, exit, and risk management.
When to explore it
The ATR Strength Index is most effective when traders want to understand the changing nature of market volatility across different timeframes. It works particularly well in markets experiencing significant transitions, such as moving from consolidation to trending phases or vice versa.
Traders can use this indicator to complement other technical analysis tools, helping to confirm market conditions and potential strategy adjustments. It is especially useful when combined with trend-following or range-trading strategies, providing additional context about the market's underlying volatility dynamics.
Keep exploring
What we’ve verified
Access, alerts and repainting behaviour have not been independently verified for this indicator. Check the creator’s current publication and settings.
General descriptions and classifications are recovered research. Verified details above identify the specific checks we have completed. Check the creator’s current publication for later changes.