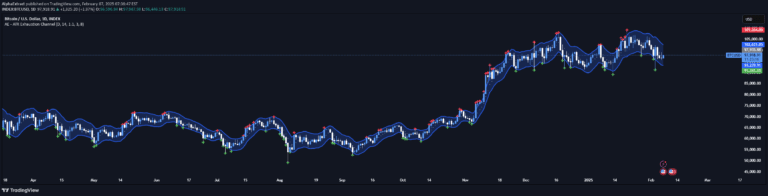
A volatility price flow indicator that processes historical price movements to identify potential market exhaustion and signal trading opportunities using customizable moving average deviations.
Explore complementary indicator rolesHow it works
The volatility price flow indicator analyzes price movements by calculating deviations from a user-defined moving average. It applies unique weighting to both candle body and wick movements on buy and sell sides, creating a dynamic band that reflects current market volatility.
Traders can customize the base moving average period, type of moving average, and historical price deviation period. The indicator can also be merged with an anchored VWAP to incorporate volume-based analysis, providing a more comprehensive view of potential price pivots and market dynamics.
Why it may be useful
This indicator helps traders identify potential market turning points by measuring price exhaustion within the context of current volatility. It provides a more nuanced approach to market analysis by independently evaluating buy and sell side movements and incorporating volume-based insights.
By offering customizable settings, the indicator allows traders to fine-tune their analysis to specific market conditions and trading styles. This flexibility enables more precise entry and exit points, potentially improving trading decision-making and risk management.
When to explore it
The volatility price flow indicator is most effective in markets experiencing significant price movements and changing volatility levels. It works best when traders carefully adjust its settings, starting with low multipliers and gradually increasing them to reduce signal quantity while improving signal quality.
Traders should use this indicator in conjunction with other technical analysis tools and risk management strategies. It is particularly useful for identifying potential trend reversals, market exhaustion points, and short-term trading opportunities in various financial markets.
Keep exploring
What we’ve verified
Access, alerts and repainting behaviour have not been independently verified for this indicator. Check the creator’s current publication and settings.
General descriptions and classifications are recovered research. Verified details above identify the specific checks we have completed. Check the creator’s current publication for later changes.