RSI Volatility Suppression Zones [BigBeluga]
An advanced RSI-based indicator that identifies periods of suppressed volatility, visualizes suppression zones, and highlights potential breakout dynamics in price movements.
Explore 11,183 indicators. Filter beyond the obvious.
Discover the tools that fit the way you trade.
11,183 tools to explore
An advanced RSI-based indicator that identifies periods of suppressed volatility, visualizes suppression zones, and highlights potential breakout dynamics in price movements.
A trading indicator that identifies potential liquidity zones by analyzing volume or open interest to reveal possible liquidation levels and market activity zones.
FRAMA Channel is a dynamic trend-following indicator that adapts to market conditions, creating an adaptive channel around price to identify trend changes and market momentum.
A market structure analysis tool that combines swing point detection with volatility bands to identify trend shifts, breakouts, and potential reversal points in price action.
Rolling ATR Bands is a dynamic indicator that uses Average True Range to create adaptive price bands, providing visual insights into trend strength and potential market reversals.
A dynamic Market Profile indicator that visualizes price distribution across time, showing how price moves through different zones and helping traders understand market behavior and potential trading opportunities.
A technical indicator that measures market volatility and momentum to help traders identify optimal trading periods and filter out false signals across different market conditions.
A trend-following indicator using Average True Range to create dynamic volatility bands that highlight market direction and potential entry/exit points with adaptive support and resistance levels.
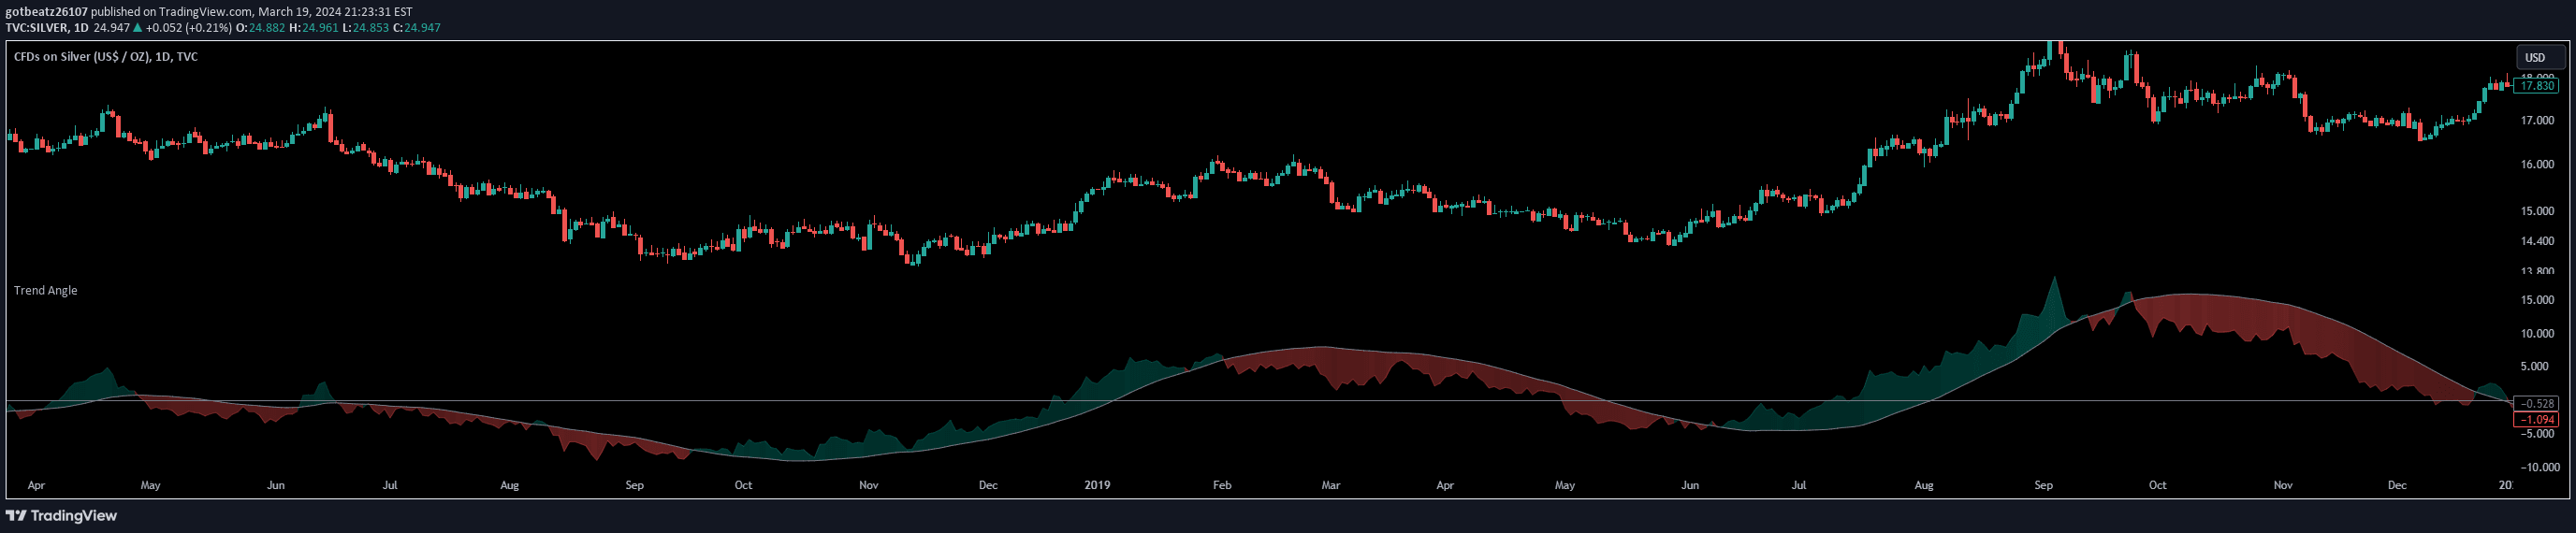
Trend Angle calculates the inclination of price movements over a specified timeframe, providing traders with a quantitative method to assess market directionality and momentum.
A harmonic pattern that identifies potential market reversals by analyzing specific Fibonacci ratios and price movements across bullish and bearish market conditions.
Advanced RSI indicator offering multiple manipulation methods to identify market conditions, overbought/oversold levels, and potential trend reversals through divergence detection.
The Squeeze & Release indicator identifies market volatility dynamics using EMA and ATR calculations, helping traders detect potential consolidation zones and potential breakout scenarios.
Likes, views, and comments are historical TradingView snapshots. They describe attention, not trading performance.