Market Structure
An advanced market structure indicator that detects swing highs and lows across multiple timeframes, providing robust insights into market dynamics and trend identification.
Explore 11,183 indicators. Filter beyond the obvious.
Discover the tools that fit the way you trade.
11,183 tools to explore
An advanced market structure indicator that detects swing highs and lows across multiple timeframes, providing robust insights into market dynamics and trend identification.
A multi-exchange liquidation level screener that identifies potential market zones where significant price movements could occur due to high leverage and open positions.
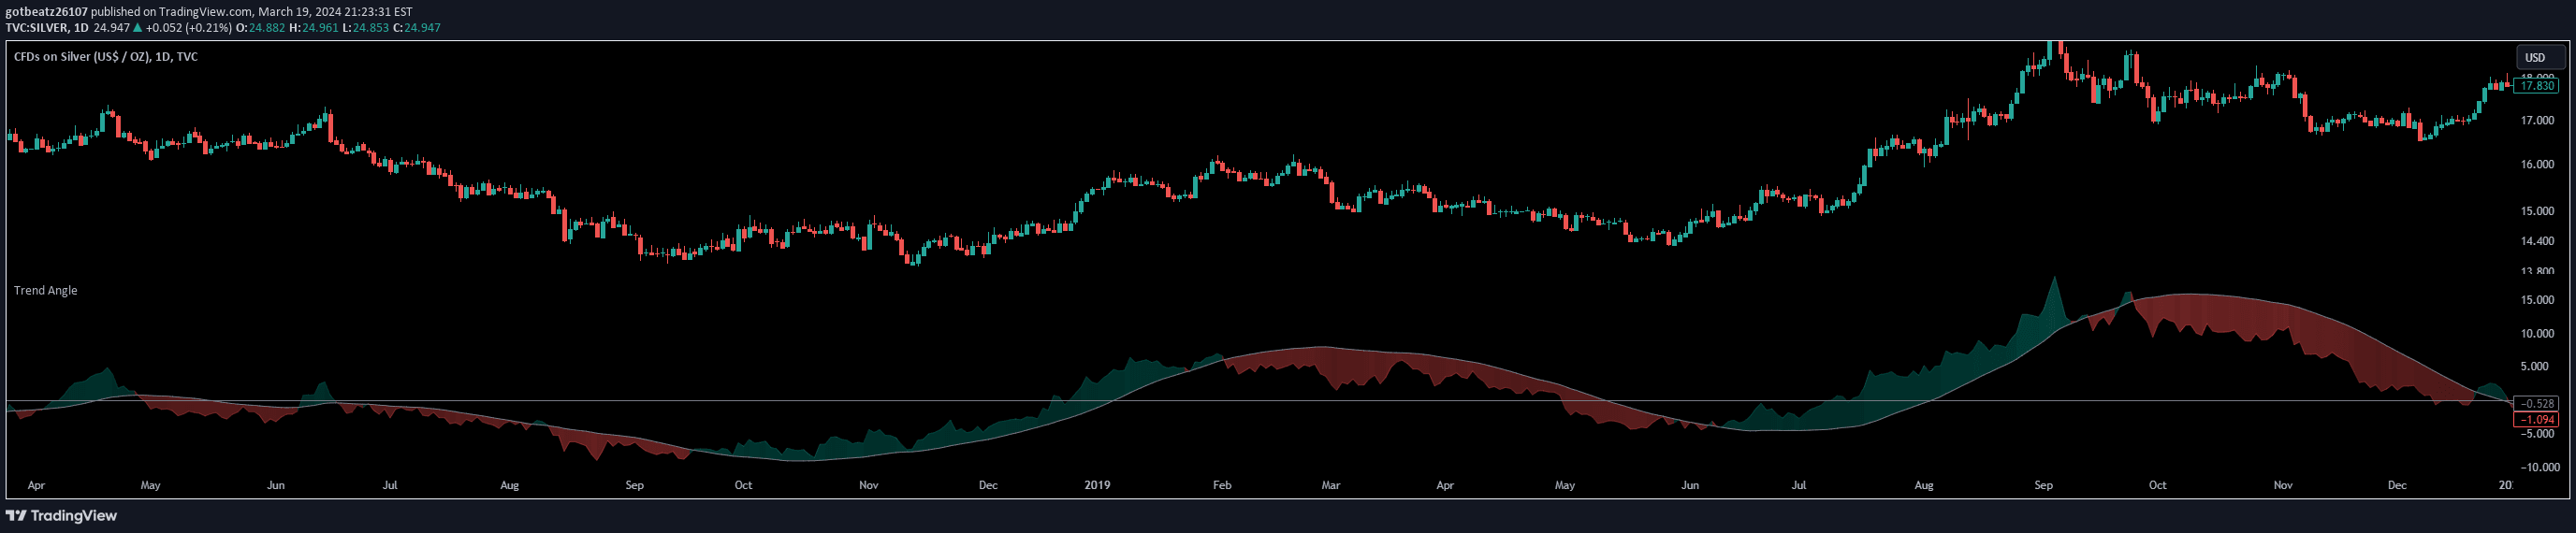
Trend Angle calculates the inclination of price movements over a specified timeframe, providing traders with a quantitative method to assess market directionality and momentum.
A blockchain-based fundamental analysis indicator that evaluates cryptocurrency market conditions using intrinsic blockchain metrics, offering traders a unique perspective on market trends and potential trading opportunities.
A multi-exchange open interest indicator that aggregates trading data to analyze market sentiment and leverage across cryptocurrency pairs through advanced visual and statistical analysis.
An adaptive technical analysis tool that dynamically adjusts market bands using five different channel methods, automatically identifying dominant market cycles to help traders spot potential price deviations.
A comprehensive indicator tracking Return on Investment percentage changes across major central banks' balance sheets, offering insights into global economic liquidity dynamics.
The Oscillator Profile Indicator (OPI) provides market trend insights by calculating Point of Control and value distribution for analyzing potential trend reversals and market movements.
Market Activity Risk (MAR) is a dynamic blockchain trading tool analyzing transaction block competition through fee momentum, helping traders anticipate market movements and strategic entry points.
A machine learning tool for analyzing financial time series data by segmenting historical price ranges into chronological splits and batches for cross-validation and model performance assessment.
Likes, views, and comments are historical TradingView snapshots. They describe attention, not trading performance.