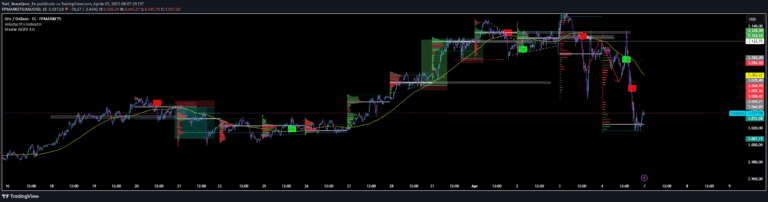
The Oscillator Profile Indicator (OPI) provides market trend insights by calculating Point of Control and value distribution for analyzing potential trend reversals and market movements.
Explore complementary indicator rolesHow it works
The Oscillator Profile Indicator (OPI) calculates the Point of Control (PoC) by determining the median value of an oscillator or price chart over a specified lookback period. By sorting and analyzing the distribution of values, it establishes a fair value zone where most trading activities occur, with upper and lower boundary lines representing specific percentiles of the value distribution.
The indicator tracks the movement of the PoC relative to zero, which helps identify potential market trends. When the PoC moves above zero on an oscillator, it suggests an uptrend, while movement below zero indicates a potential downtrend. The visual representation includes colored fills between boundary lines to help traders quickly interpret market dynamics.
Why it may be useful
The OPI provides traders with a nuanced view of market trends by offering more sophisticated insights beyond traditional trend-following methods. By profiling the value distribution and tracking the Point of Control, traders can gain a deeper understanding of market sentiment and potential trend reversals that might not be immediately apparent through simpler indicators.
This approach allows traders to assess the concentration of trading activity and identify potential shifts in market momentum. The OPI's ability to work with both price charts and oscillators like RSI or MACD makes it a versatile tool for understanding market behavior across different financial instruments and timeframes.
When to explore it
The Oscillator Profile Indicator works best in markets with clear trending characteristics, where price movements show consistent directional momentum. It is particularly effective when used with oscillators like RSI or MACD, as these provide more refined signals about market conditions compared to raw price data.
Traders should apply the OPI in conjunction with other technical analysis tools to confirm signals and reduce false positives. It is most valuable during periods of established market trends, such as during strong bullish or bearish market phases, where the Point of Control's movement can provide early indications of potential trend continuations or reversals.
Keep exploring
What we’ve verified
Access, alerts and repainting behaviour have not been independently verified for this indicator. Check the creator’s current publication and settings.
General descriptions and classifications are recovered research. Verified details above identify the specific checks we have completed. Check the creator’s current publication for later changes.