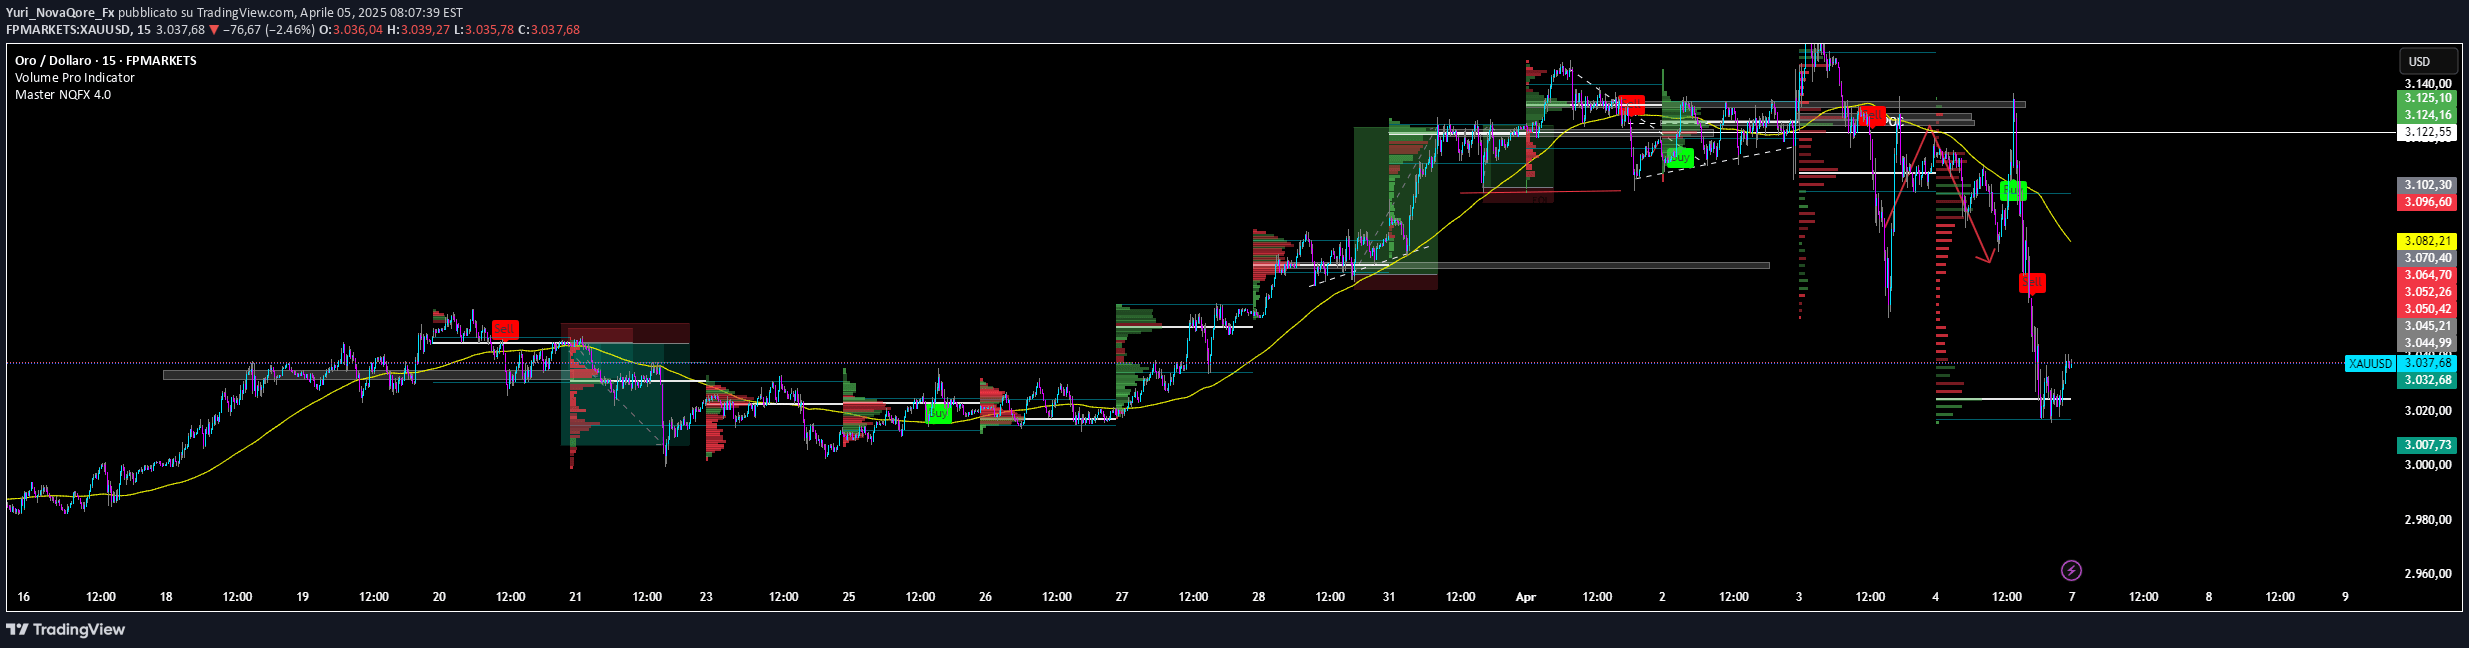
Volume Pro Indicator visualizes trading volume distribution across price levels, revealing market activity concentration and helping traders identify significant price zones with color-coded volume representation.
Explore complementary indicator rolesHow it works
The Volume Pro Indicator analyzes price levels and displays trading volume using color-coded zones: green for lower, magenta for middle, and cyan for upper price ranges. It calculates volume concentration by mapping trading activity across different price levels. The indicator identifies the Volume Point of Control (VPOC), which represents the price level with the highest trading volume.
By processing historical price data, it generates a visual representation of volume distribution. The tool can be customized to analyze different time periods and adjust calculation resolution. Users can modify colors and component visibility to suit their analytical preferences
Why it may be useful
The Volume Pro Indicator provides critical insights into market dynamics by revealing where trading activity concentrates within a price range. Understanding volume distribution helps traders identify potential support and resistance levels more effectively. By highlighting the VPOC, traders can recognize the most significant price zones with maximum trading interest.
The color-coded visualization allows quick interpretation of market sentiment and trading activity. This tool enhances traders' ability to make informed decisions by providing a comprehensive view of volume patterns. It bridges the gap between price movement and underlying market participation
When to explore it
The Volume Pro Indicator works best on higher timeframes like 1-hour, 4-hour, and daily charts with liquid markets. It is particularly useful during range-bound market conditions where volume distribution provides critical insights. Traders can leverage this indicator when analyzing potential trend reversals, breakouts, or consolidation zones.
It is most effective in markets with consistent trading volume and clear price structures. The indicator helps validate trading strategies by confirming volume concentration at key price levels. Professionals find it valuable for understanding market structure and making more precise entry and exit decisions
Keep exploring
What we’ve verified
Access, alerts and repainting behaviour have not been independently verified for this indicator. Check the creator’s current publication and settings.
General descriptions and classifications are recovered research. Verified details above identify the specific checks we have completed. Check the creator’s current publication for later changes.