
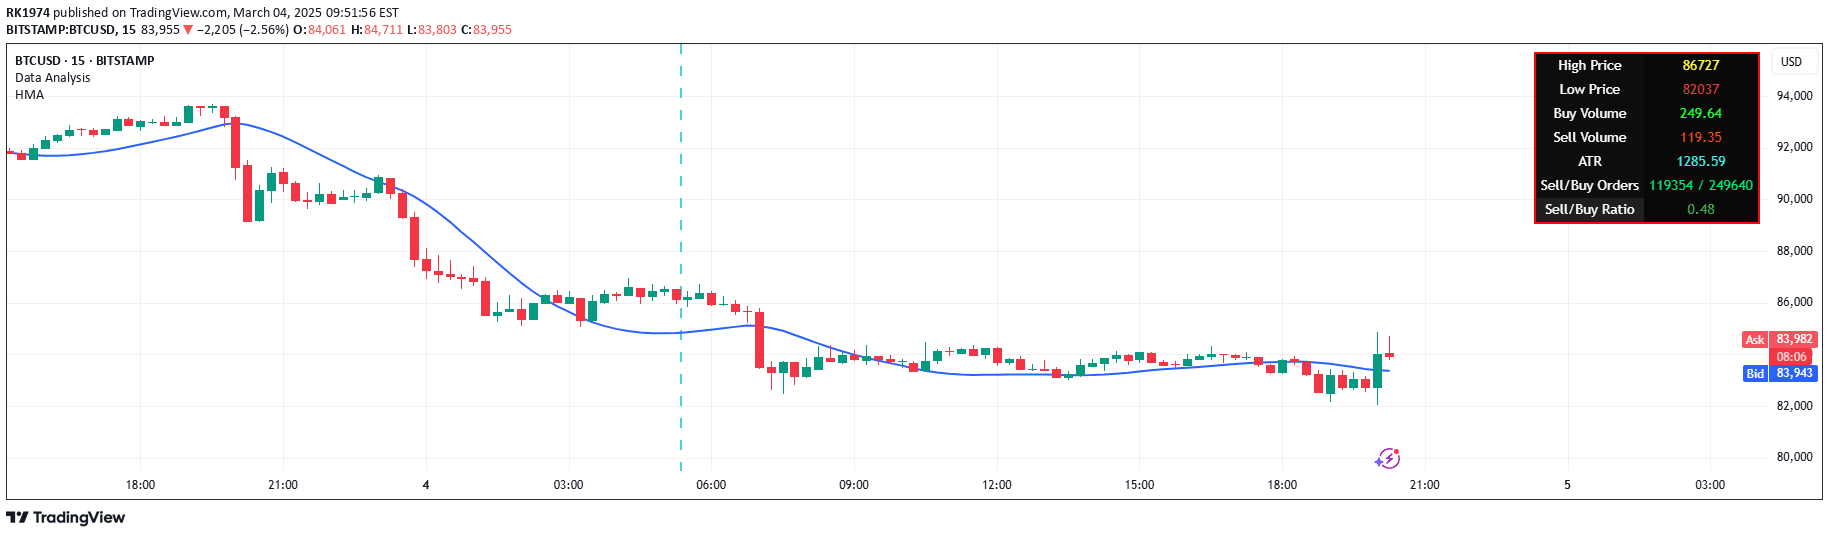
A volume analysis tool that aggregates buy and sell volume over a customizable timeframe, offering traders insights into market sentiment through detailed volume metrics.
Explore complementary indicator rolesHow it works
The Volume Data Customized Timeframe indicator retrieves volume data for a selected timeframe and calculates volume statistics based on a user-defined lookback period. It aggregates bullish and bearish volume by analyzing the closing prices of bars, distinguishing between buying and selling pressure.
The indicator then computes the sell-to-buy volume ratio, providing a color-coded representation of market sentiment. By presenting the data in a customizable table, traders can quickly assess volume trends, with green indicating bullish dominance and red signaling bearish pressure.
Why it may be useful
Volume analysis is crucial for understanding market dynamics and confirming price movements, as it reveals the strength behind market trends and potential reversals. By providing a detailed breakdown of buying and selling volume, traders can gain deeper insights into market sentiment and the underlying momentum of price action.
The customizable nature of this indicator allows traders to adapt their volume analysis to different trading styles and timeframes, making it a versatile tool for identifying potential trading opportunities and assessing market participation.
When to explore it
This volume indicator is most effective during periods of significant market movement or when traders want to confirm the strength of a current trend. It can be particularly useful during breakouts, trend reversals, or when evaluating the sustainability of a price movement.
Traders should utilize this tool in conjunction with other technical indicators and price action analysis to validate trading decisions. It is especially valuable in volatile markets or when looking to understand the balance between buying and selling pressure across different timeframes.
Keep exploring
What we’ve verified
Access, alerts and repainting behaviour have not been independently verified for this indicator. Check the creator’s current publication and settings.
General descriptions and classifications are recovered research. Verified details above identify the specific checks we have completed. Check the creator’s current publication for later changes.


