Reversal Probability Zone & Levels [LuxAlgo]
A tool that identifies potential price reversal zones using statistical probability by analyzing historical swing points and calculating precise percentile-based predictions.
Explore 11,183 indicators. Filter beyond the obvious.
Discover the tools that fit the way you trade.
11,183 tools to explore
A tool that identifies potential price reversal zones using statistical probability by analyzing historical swing points and calculating precise percentile-based predictions.
A trading tool that identifies top-performing stocks within specific industry groups by analyzing performance metrics like YTD return and relative strength.
The Bollinger Band Width Percentile measures relative volatility by calculating the percentage of historical periods where Bollinger Band width was narrower than the current period.
The Relative Trend Index (RTI) is an advanced technical indicator that measures trend strength by analyzing price positioning within its recent range, offering more adaptive insights than traditional momentum tools.
A predictive indicator that estimates maximum and minimum price levels within a specified trading session, providing support/resistance insights and hit rate probabilities for traders.
A probabilistic grid tool that visualizes potential price reversal locations using a 10x10 matrix, helping traders understand the likelihood of future market movements.
A machine learning-enhanced RSI indicator that dynamically adapts overbought and oversold thresholds using clustering techniques, providing more precise trading signals across different market conditions.
A sophisticated trading indicator that tracks median price proximity using percentile calculations within dynamic standard deviation bands to help traders identify market trends and potential reversals.
A trend-following indicator that uses Double Exponential Moving Average with percentiles to generate potential long and short trading signals across different market conditions.
Rolling VWAP Channel creates a dynamic indicator using multiple Volume Weighted Average Prices to analyze price clusters and potential market directional changes through percentile interpolation.
A sophisticated statistical approach using weighted Harrell-Davis quantile estimators to analyze price distributions more accurately than traditional methods, providing robust insights into market behavior.
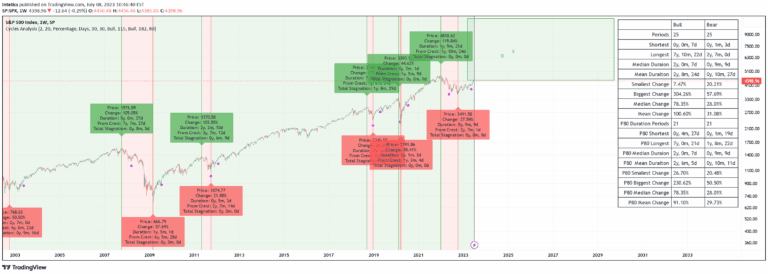
A market cycle analysis tool that visually represents bull and bear market phases, predicting potential future price movements by analyzing historical cycle patterns and durations.
Likes, views, and comments are historical TradingView snapshots. They describe attention, not trading performance.