
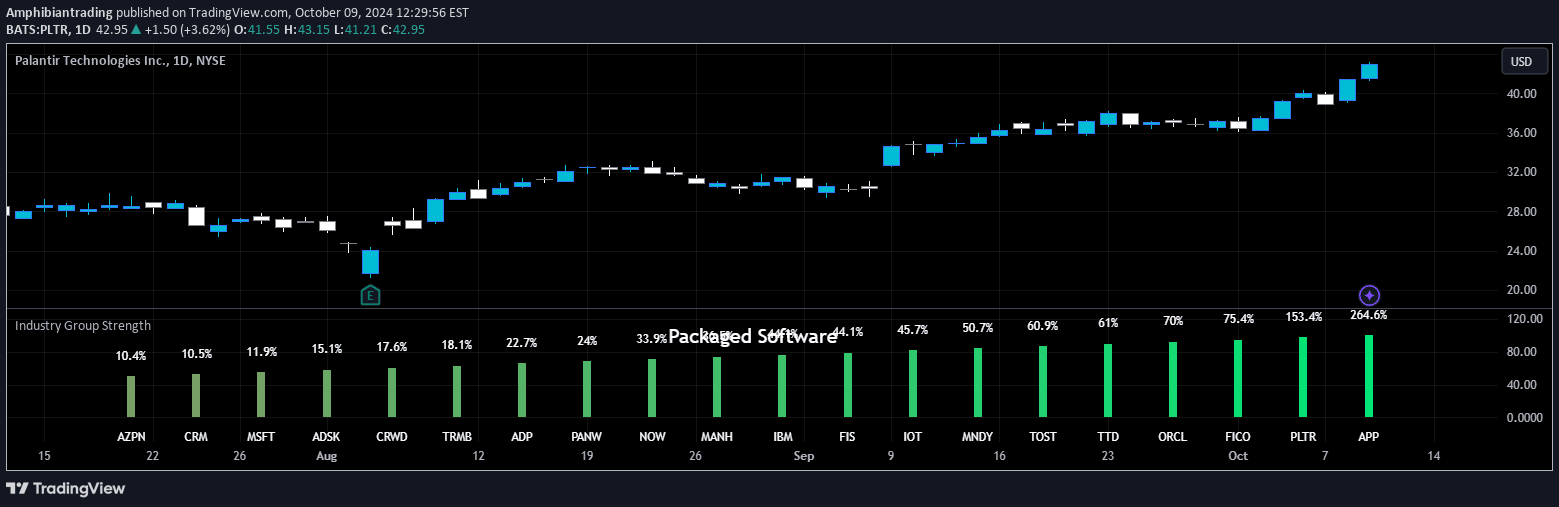
A trading tool that identifies top-performing stocks within specific industry groups by analyzing performance metrics like YTD return and relative strength.
Explore complementary indicator rolesHow it works
The Industry Group Strength indicator starts by filtering stocks based on predefined criteria such as market capitalization over $2 billion, price above $10, and primary listing status. Once the relevant stocks are identified, the tool automatically recognizes the industry group of the current stock on the chart.
The indicator then retrieves and displays performance data for the entire industry group, ranking stocks based on selected metrics like YTD return, RS Rating, or percentage return. Stocks are visually presented in a table format with color-coded lines representing their percentile rank within the industry group.
Why it may be useful
This indicator provides traders with a comprehensive view of stock performance within specific industry groups, helping them identify leading and lagging stocks. By normalizing performance metrics and using a relative strength calculation, it offers a standardized way to compare stocks across different sectors.
The visual representation and color-coded ranking system allow traders to quickly assess which stocks are outperforming or underperforming within their industry. This approach helps investors make more informed decisions by understanding the broader context of a stock's performance relative to its peers.
When to explore it
The Industry Group Strength indicator is most useful when traders want to identify top-performing stocks within a specific sector or industry. It is particularly valuable during market rotations or when looking to diversify investments across different industry groups.
Traders can use this tool during both bullish and bearish market conditions to find potential investment opportunities or to understand the relative strength of stocks within an industry. It is especially helpful for those seeking to make data-driven investment decisions based on comprehensive performance analysis.
Keep exploring
What we’ve verified
Access, alerts and repainting behaviour have not been independently verified for this indicator. Check the creator’s current publication and settings.
General descriptions and classifications are recovered research. Verified details above identify the specific checks we have completed. Check the creator’s current publication for later changes.


