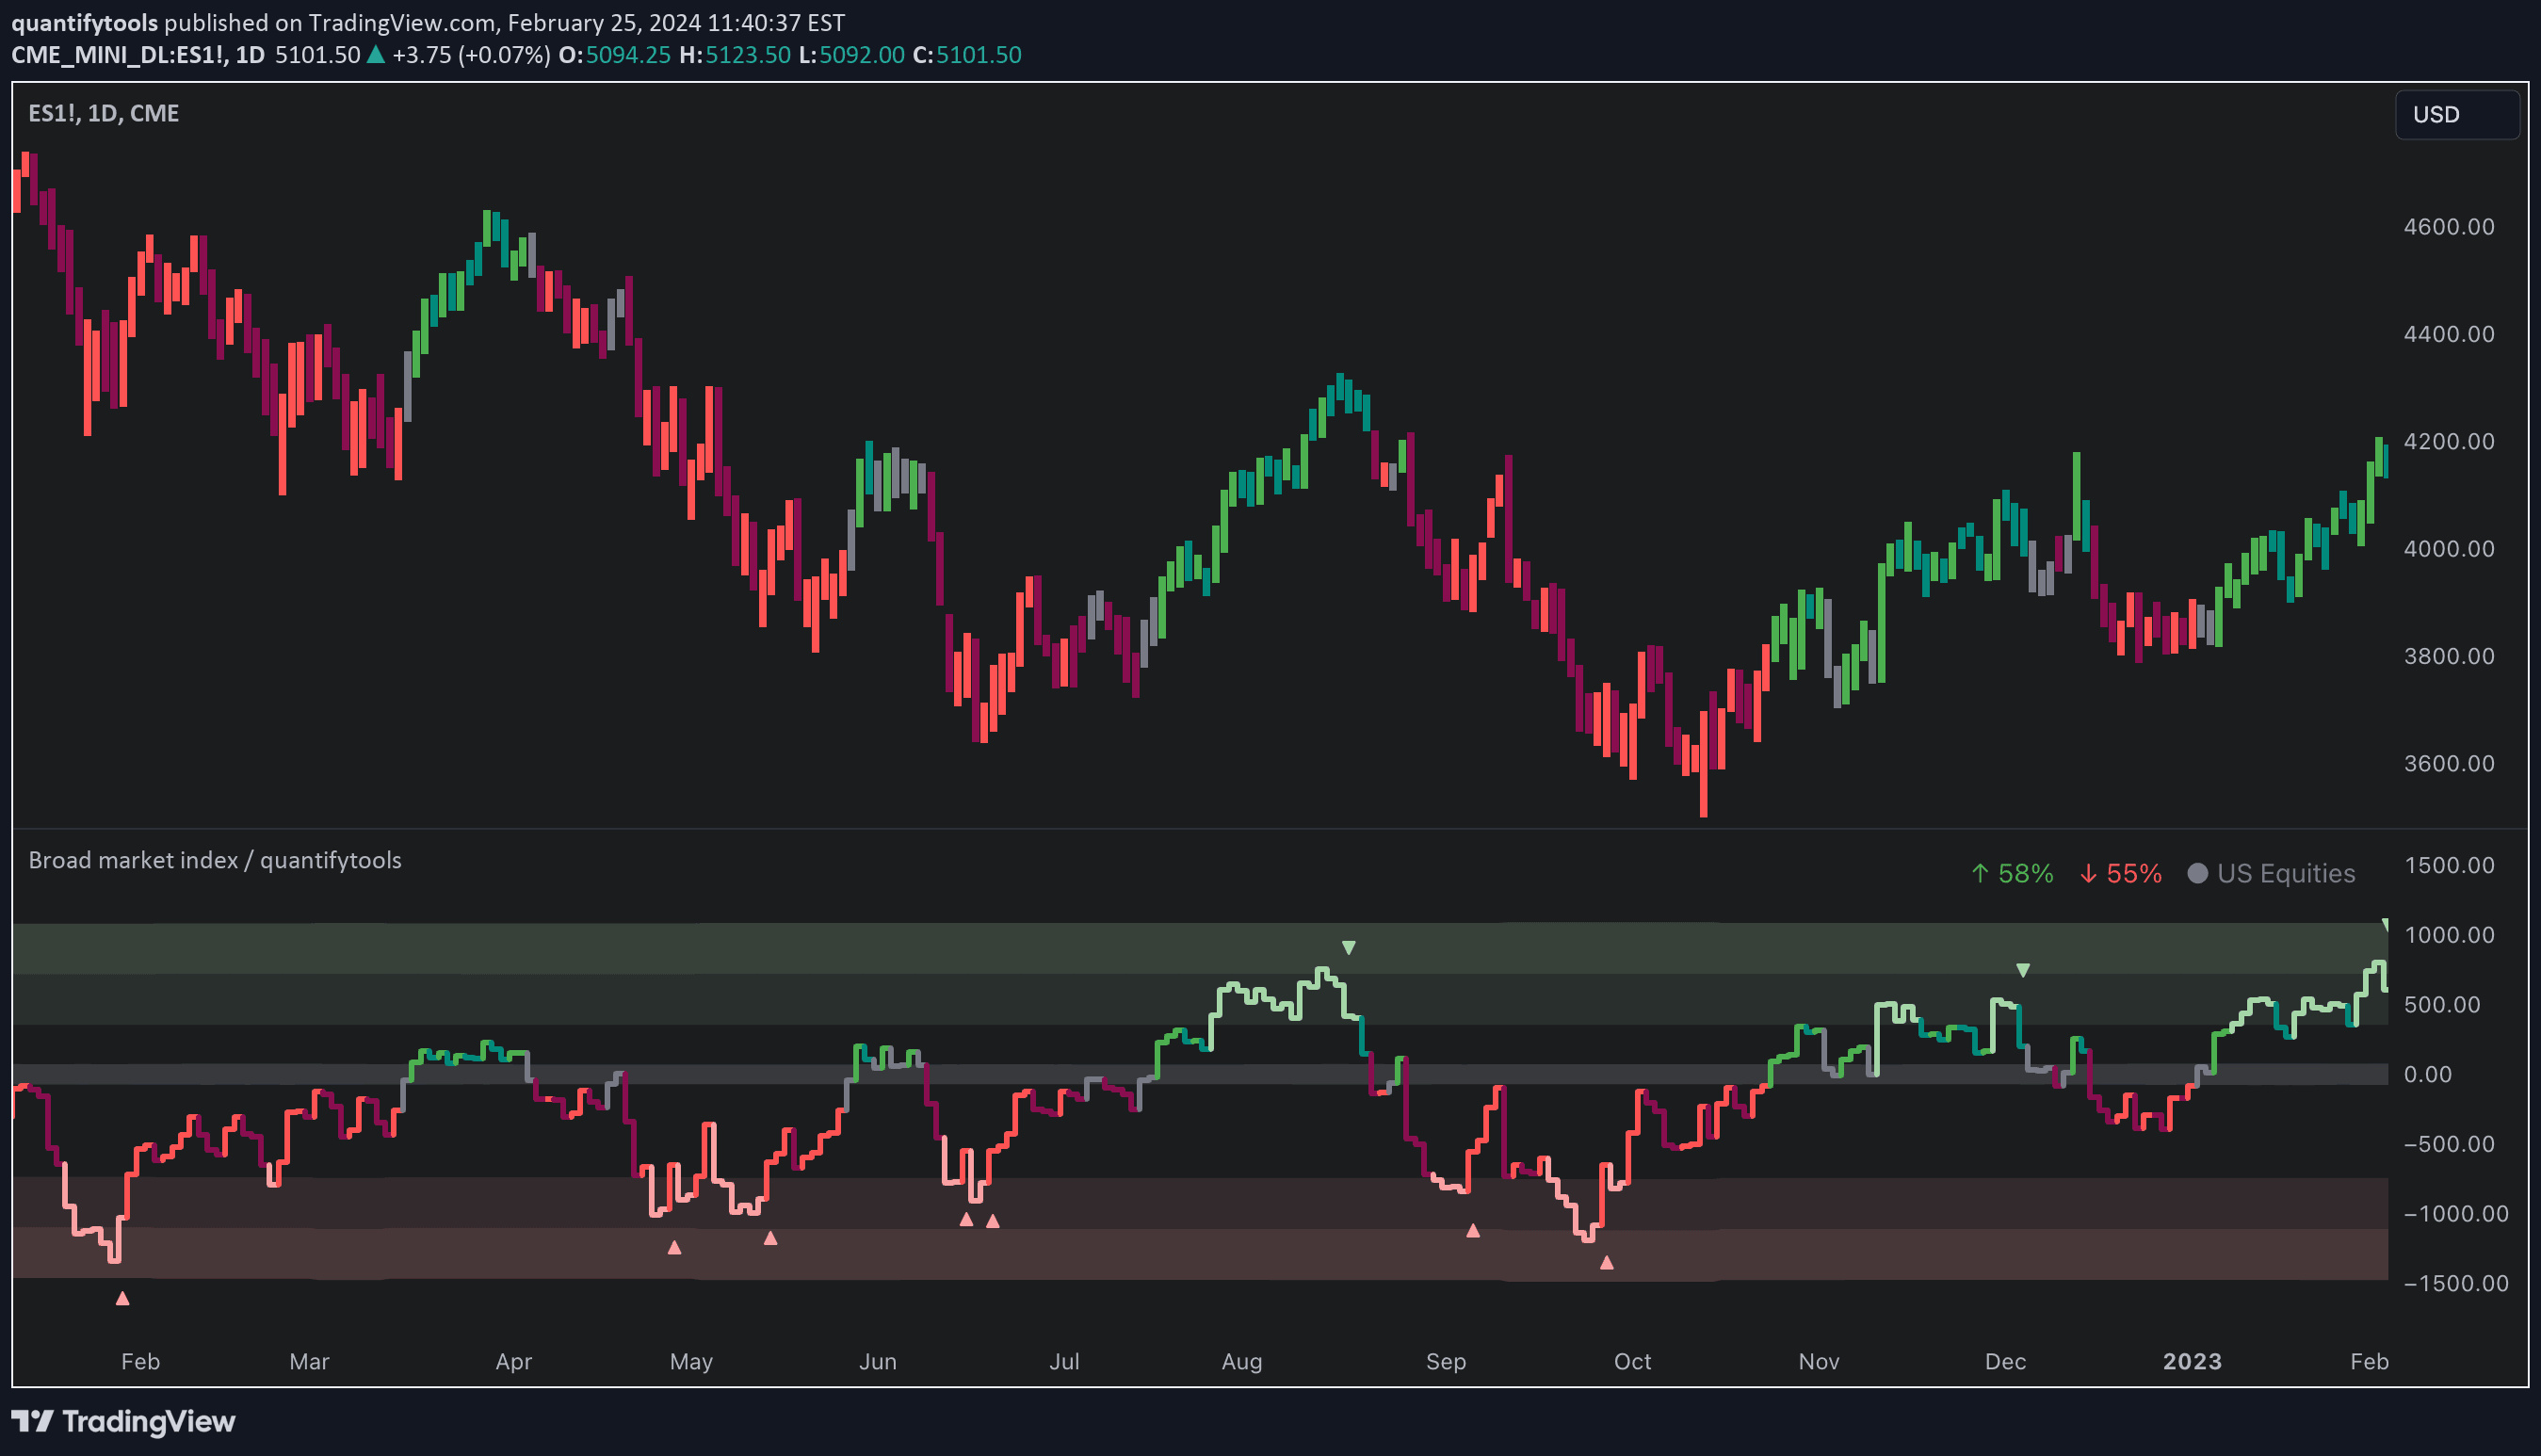
Market Breadth indicator tracking the percentage of S&P 500 stocks above their 200-day moving average, using EMAs to visualize market strength and potential trend reversals.
Explore complementary indicator rolesHow it works
The Market Breadth (S5TH) indicator analyzes the percentage of S&P 500 stocks trading above their 200-day simple moving average. It overlays two exponential moving averages (EMAs) - a 200-period long-term trend EMA and a 5-period short-term trend EMA - to provide a comprehensive view of market dynamics.
The indicator uses advanced pivot detection with prominence filters to identify significant market peaks and troughs. Red markers indicate major breadth peaks (overbought conditions), while blue and green markers highlight different types of market troughs, signaling potential trend reversals or short-term rebounds.
Why it may be useful
Market Breadth provides crucial insights into the overall market sentiment and underlying strength of individual stocks within the S&P 500 index. By tracking the percentage of stocks above their long-term moving average, traders can gauge the broader market's health and identify potential turning points in market trends.
The indicator's multi-layered approach allows traders to distinguish between short-term fluctuations and more significant market movements. This helps in making more informed decisions about market entry, exit, and risk management strategies across different trading timeframes.
When to explore it
The Market Breadth indicator is most effective during periods of market uncertainty or potential trend reversals. Traders can use the red peak markers to identify potential overbought conditions and consider reducing long positions or preparing for a potential market pullback.
The blue and green trough markers are particularly useful for identifying potential entry points during market corrections or short-term rebounds. The pink background, indicating a long-term downtrend and short-term weakness, serves as a valuable risk-off signal for traders looking to protect their capital during challenging market conditions.
Keep exploring
What we’ve verified
Access, alerts and repainting behaviour have not been independently verified for this indicator. Check the creator’s current publication and settings.
General descriptions and classifications are recovered research. Verified details above identify the specific checks we have completed. Check the creator’s current publication for later changes.