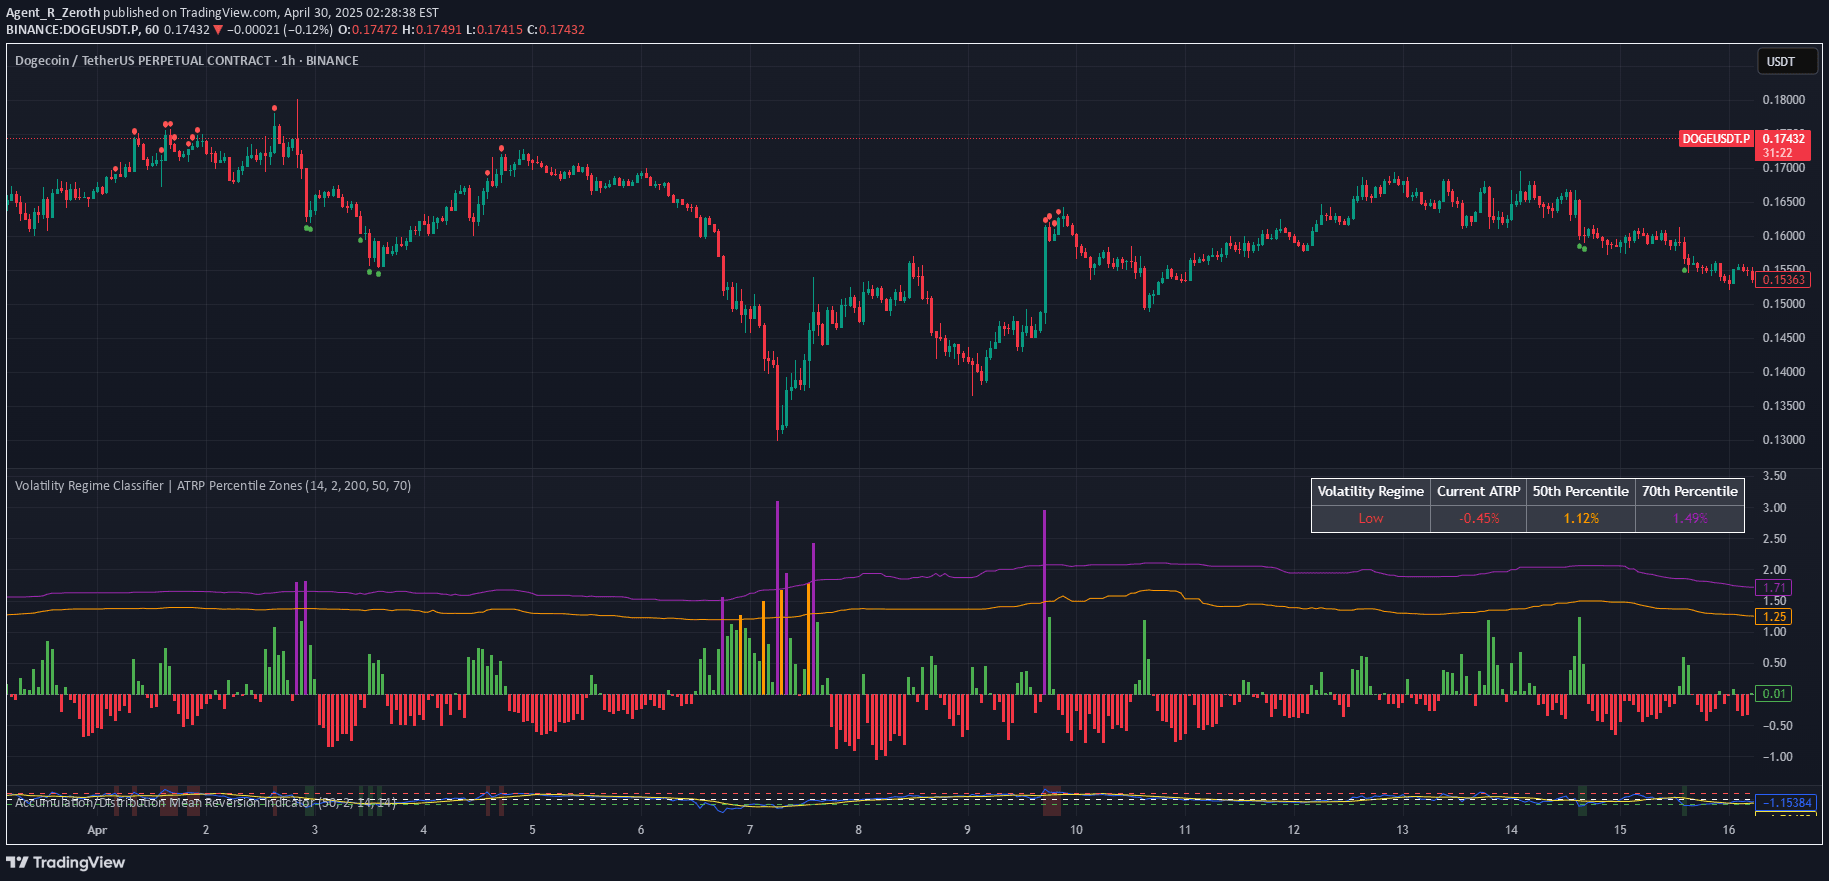
A statistical price analysis tool that calculates current price percentile within historical range, helping traders understand price positioning and potential market extremes.
Explore complementary indicator rolesHow it works
The Close Price Percentile indicator first establishes a historical price range over a specified lookback period, typically 365 periods. It then calculates where the current price sits within this range, expressing its position as a percentile from 0-100%.
The indicator divides the price range into segments and tracks how many data points fall into each segment. Users can customize threshold levels to define specific price zones. Visual lines and statistical data help traders quickly interpret price positioning relative to historical performance
Why it may be useful
Understanding price percentile provides crucial context for trading decisions by revealing whether current prices are near historical extremes. This perspective helps traders identify potential overbought or oversold conditions more objectively.
By quantifying price positioning statistically, traders can make more informed entry and exit choices. The indicator transforms raw price data into meaningful insights about market behavior. It offers a nuanced view beyond simple price movements, enabling more sophisticated market analysis
When to explore it
This indicator works best in markets with clear historical price patterns and consistent volatility. It's particularly useful during range-bound market conditions where price tends to oscillate between predictable levels. Traders can apply it across various asset classes including stocks, forex, and commodities.
It's most effective when combined with other technical indicators for confirmation. The tool is especially valuable for mean reversion strategies and identifying potential trend reversals. Longer lookback periods provide more robust statistical insights
Keep exploring
What we’ve verified
Access, alerts and repainting behaviour have not been independently verified for this indicator. Check the creator’s current publication and settings.
General descriptions and classifications are recovered research. Verified details above identify the specific checks we have completed. Check the creator’s current publication for later changes.