Cycles Analysis
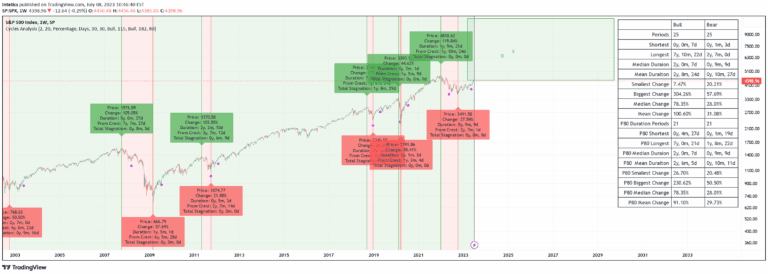
A market cycle analysis tool that visually represents bull and bear market phases, predicting potential future price movements by analyzing historical cycle patterns and durations.
Explore 11,183 indicators. Filter beyond the obvious.
Discover the tools that fit the way you trade.
11,183 tools to explore
A market cycle analysis tool that visually represents bull and bear market phases, predicting potential future price movements by analyzing historical cycle patterns and durations.
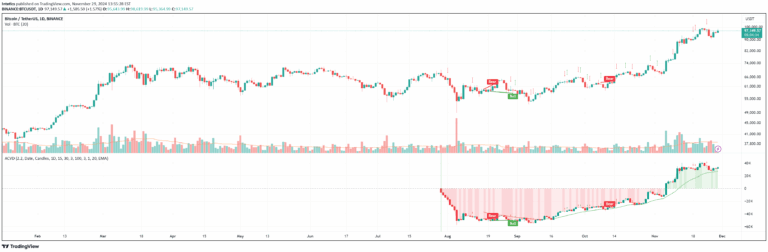
A custom cumulative volume delta indicator that measures market participant aggressiveness and helps traders understand the underlying buying and selling dynamics within price movements.
A trading signal that measures the acceleration of moving averages, revealing trend speed and potential strength changes by analyzing percentage variations in moving average movements.
A visual indicator that helps traders track price movements across multiple timeframes by marking higher timeframe candle starts and highlighting price positioning.
Likes, views, and comments are historical TradingView snapshots. They describe attention, not trading performance.