
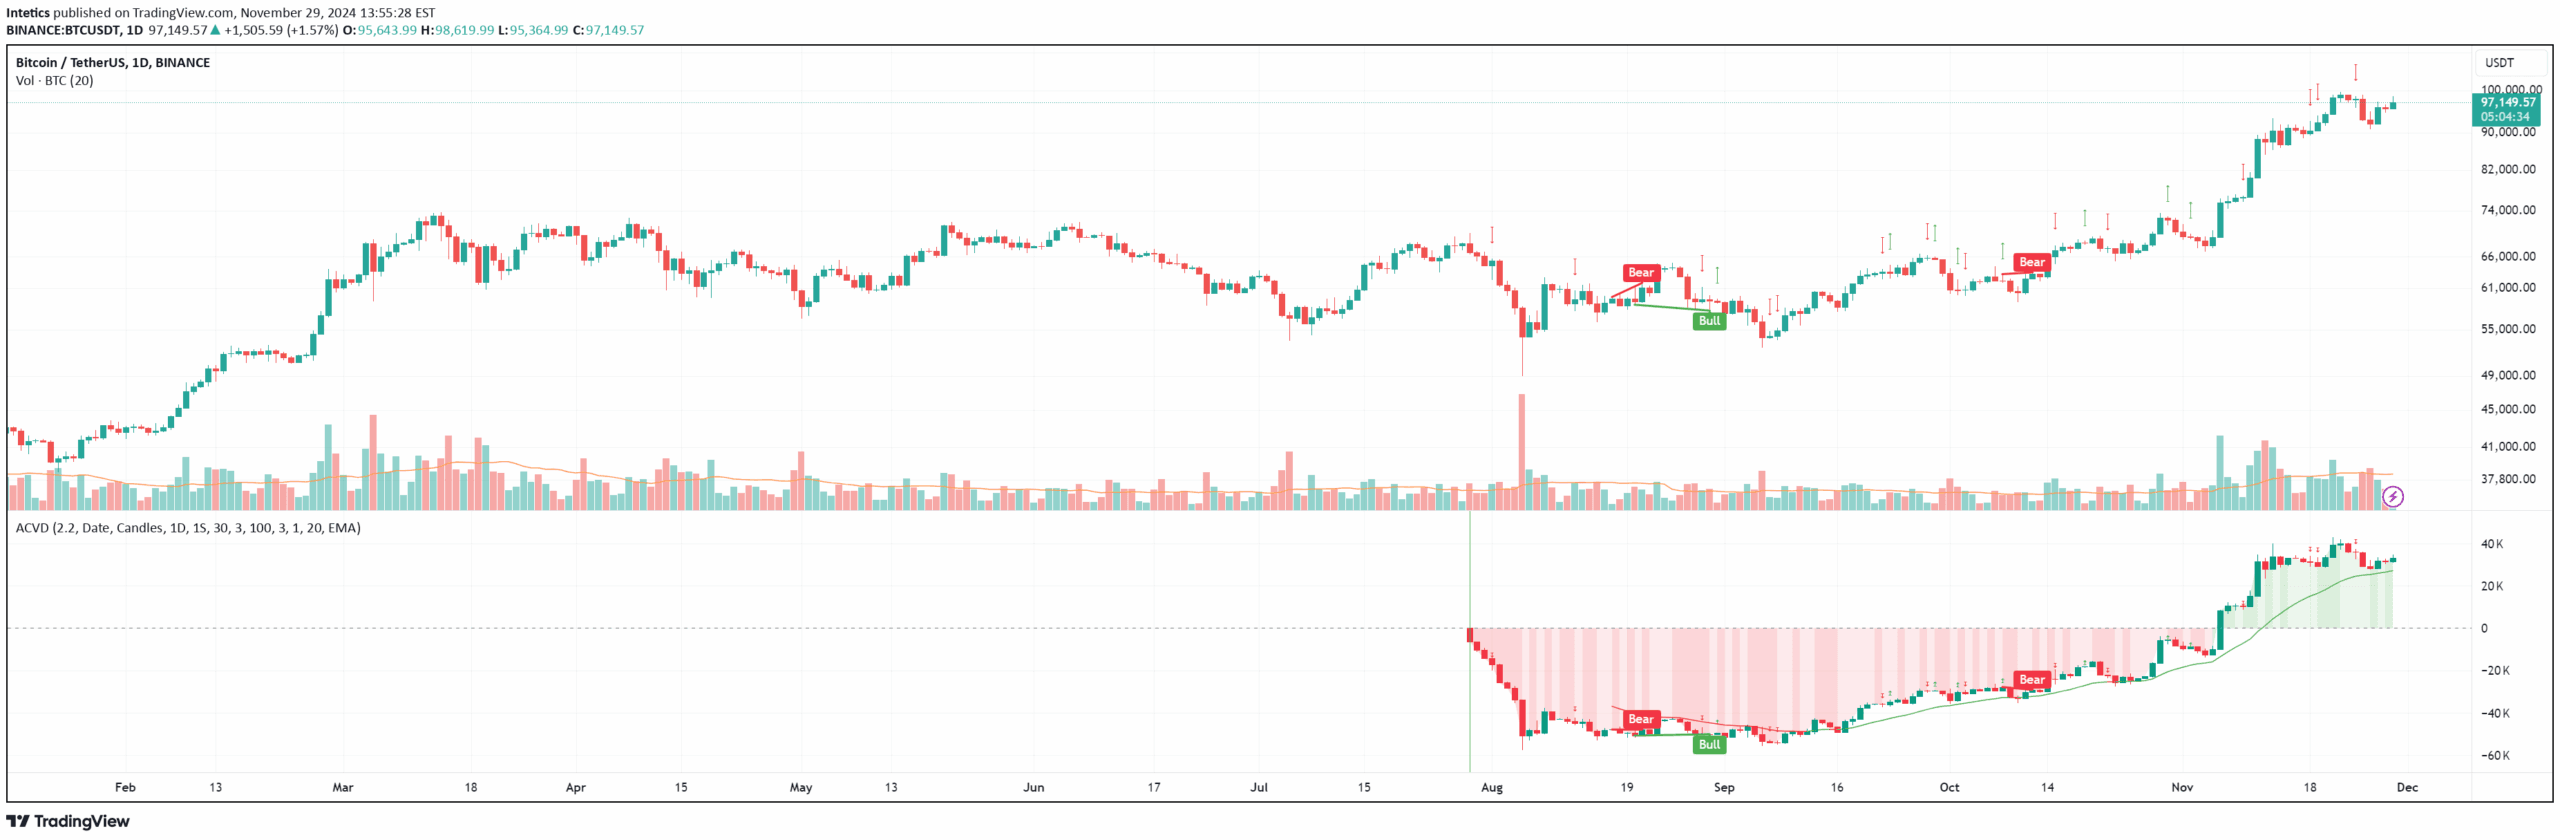
A custom cumulative volume delta indicator that measures market participant aggressiveness and helps traders understand the underlying buying and selling dynamics within price movements.
Explore complementary indicator rolesHow it works
The indicator calculates cumulative volume delta (CVD) by allowing traders to set a custom start date for tracking volume aggressiveness. It monitors the relationship between price movement and volume delta, highlighting periods where market participants' actions diverge from price trends.
By marking candles where volume aggressiveness moves opposite to price direction with blue dots, traders can visually identify potential trend weakness or strength. The indicator provides a granular view of market dynamics, with more precise results achievable through smaller custom timeframes.
Why it may be useful
CVD helps traders understand the underlying strength or weakness of price movements by revealing the true aggression of buyers and sellers. It provides insights beyond simple price action, showing whether market participants are genuinely supporting a trend or merely creating temporary price movement.
By tracking volume delta, traders can anticipate potential trend reversals or continuations before they become apparent in price charts. This enables more informed decision-making and helps identify when a bull or bear market might be developing.
When to explore it
The indicator is most effective during periods of complex price movements where volume dynamics might not be immediately apparent. It works best when analyzing recent market tops or bottoms to understand the underlying market sentiment and potential future direction.
Traders should utilize this tool when seeking to confirm trend strength, identify potential trend reversals, or gain deeper insights into market participant behavior. It is particularly useful for active traders who want to understand the psychological dynamics driving price movements.
Keep exploring
What we’ve verified
Access, alerts and repainting behaviour have not been independently verified for this indicator. Check the creator’s current publication and settings.
General descriptions and classifications are recovered research. Verified details above identify the specific checks we have completed. Check the creator’s current publication for later changes.


