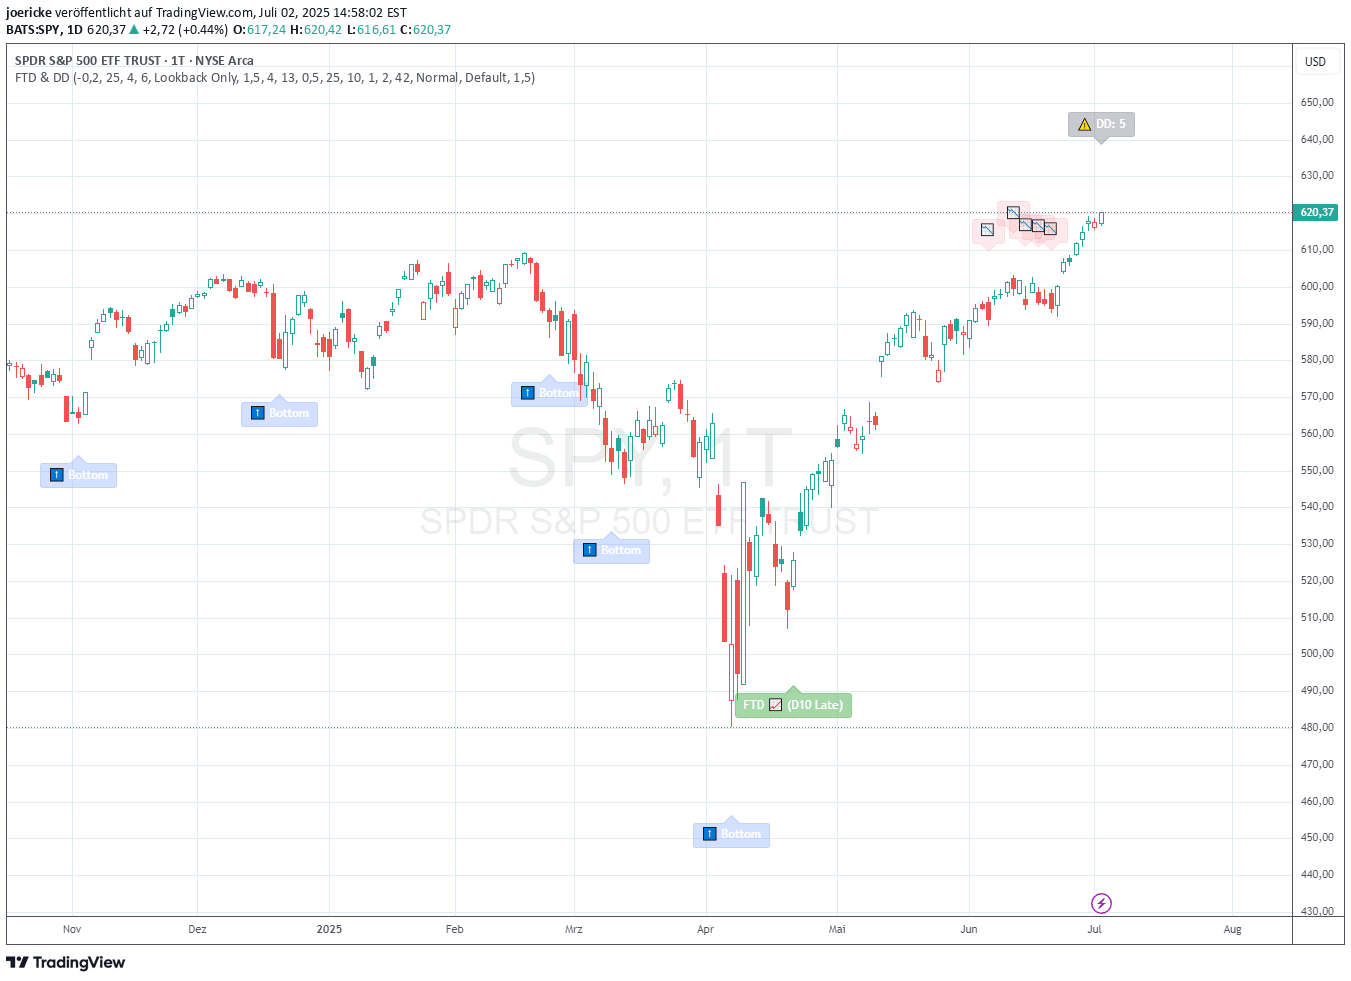
A smart volume indicator that highlights candles with exceptional delta volume, revealing institutional trading activity and potential market turning points through color-coded visualization.
Explore complementary indicator rolesHow it works
The Delta Volume Color Coder calculates the difference between buying and selling pressure within each candle, creating a dynamic threshold for volume analysis. It uses a lookback period to establish baseline volume levels and then applies color coding based on the deviation from these average volumes.
The indicator automatically detects significant volume events by comparing current delta volume against recent historical activity. When volume reaches predefined thresholds, it applies specific colors to candles, with white and violet representing extreme institutional activity, and green and red showing strong buying or selling pressure.
Why it may be useful
This indicator provides traders with an intuitive visual method to identify institutional trading activity and potential market turning points. By simplifying complex volume data into easy-to-understand color signals, it helps traders quickly recognize significant market events without cluttering their charts.
The Delta Volume Color Coder bridges the gap between raw volume data and actionable trading insights, allowing traders to see where smart money is moving in real-time. Its ability to highlight potential reversals, breakouts, and trend confirmations makes it a powerful tool for understanding market dynamics across different timeframes and asset classes.
When to explore it
The Delta Volume Color Coder is most effective when used on lower timeframes like 1-15 minutes for precise entry and exit points in scalping and day trading strategies. It provides clear signals during volatile market conditions and at critical technical levels such as support and resistance zones.
Traders should pay special attention to white and violet candles, which often indicate potential trend reversals or breakouts. The indicator works best when combined with other technical analysis tools and used across multiple timeframes to confirm trading signals and understand broader market momentum.
Keep exploring
What we’ve verified
Access, alerts and repainting behaviour have not been independently verified for this indicator. Check the creator’s current publication and settings.
General descriptions and classifications are recovered research. Verified details above identify the specific checks we have completed. Check the creator’s current publication for later changes.