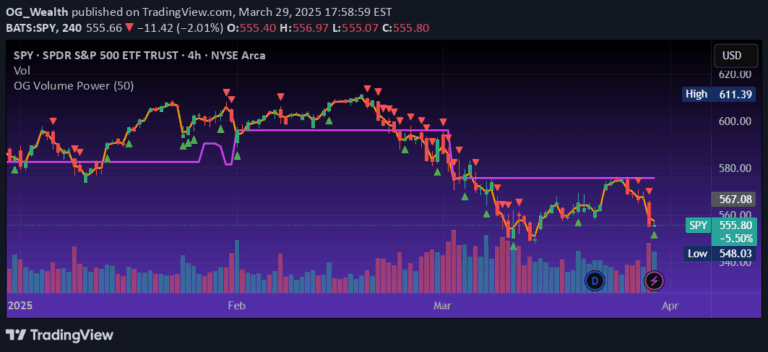
A dynamic trendline indicator that detects market pivot points using volume-confirmed breakouts, helping traders identify potential trend reversals and significant price movements.
Explore complementary indicator rolesHow it works
The indicator uses pivot-based trendline detection to automatically scan and plot dynamic trend lines on price charts. It identifies pivot highs and lows over a defined lookback period, creating green uptrend lines for higher pivot lows and red downtrend lines for lower pivot highs. These lines continuously update as new pivots form, providing real-time trend guidance.
Simultaneously, the tool performs volume ratio analysis by comparing current bar volume against a moving average volume. It calculates volume intensity ratios and applies color-coded visual cues to highlight volume surges. When price breaks through a predefined threshold on these trendlines, the indicator labels the movement as a 'BREAKOUT' or 'BREAKDOWN', offering traders clear signals of potential market shifts.
Why it may be useful
By combining trendline analysis with volume confirmation, this indicator provides traders with a more comprehensive view of market dynamics than traditional single-method approaches. The integrated volume analysis helps validate potential trend changes, reducing the likelihood of false signals and offering deeper insights into market participation and momentum.
The tool's ability to dynamically update trendlines and provide clear visual markers makes complex market information more accessible and interpretable. Traders can quickly assess trend direction, volume strength, and potential breakout opportunities, enabling more informed and confident decision-making across different market conditions and timeframes.
When to explore it
This indicator works best in markets with clear trending characteristics and sufficient trading volume. It is particularly effective for traders seeking to identify potential trend reversals or continuation patterns across various timeframes, from intraday to swing trading intervals. The tool's flexibility allows it to be applied to different financial instruments and market types.
Traders should find this signal most valuable when combined with additional analytical tools and confirmation methods. It is especially useful during periods of increased market volatility, when traditional trend-following methods might produce less reliable signals. By providing a multi-dimensional view of market movements, the indicator helps traders navigate complex market environments with greater precision and confidence.
Keep exploring
What we’ve verified
Access, alerts and repainting behaviour have not been independently verified for this indicator. Check the creator’s current publication and settings.
General descriptions and classifications are recovered research. Verified details above identify the specific checks we have completed. Check the creator’s current publication for later changes.