Volumatic Variable Index Dynamic Average [BigBeluga]
A dynamic trend-following indicator that uses Variable Index Dynamic Average to adapt to market volatility, providing insights into price movements and volume pressure.
Explore 11,183 indicators. Filter beyond the obvious.
Discover the tools that fit the way you trade.
11,183 tools to explore
A dynamic trend-following indicator that uses Variable Index Dynamic Average to adapt to market volatility, providing insights into price movements and volume pressure.
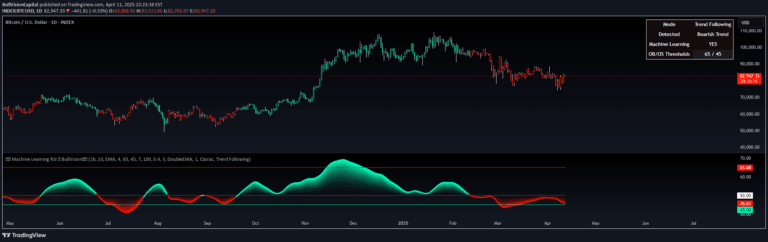
A sophisticated RSI indicator that uses machine learning and K-Nearest Neighbors to dynamically adapt momentum analysis by comparing current market conditions with historical patterns.
A dynamic trendline indicator that detects and highlights support/resistance lines in real-time, with customizable filters for angle, length, and break detection across different market conditions.
Advanced trading toolkit identifying key market zones, order blocks, and trendlines to align with smart money strategies and institutional trading activity.
An advanced trend detection tool that uses EMA crossovers to identify market flow, dynamic price levels, and trend momentum with visual gradient bands.
A trading indicator that identifies high-liquidity zones by analyzing volume concentrations at key market price levels, helping traders map potential support and resistance areas.
A dynamic trend-following indicator using Triangular Hull Moving Average that provides smoothed price analysis with volatility insights and trend reversal signals.
Trendline Pivot Indicator automatically draws and recognizes dynamic trend lines connecting pivot highs and lows, providing visual support and resistance reference points on price charts.
An advanced trend-following indicator combining SuperTrend methodology with normalized volume visualization to help traders identify market direction and volume intensity.
A dynamic trend-following oscillator based on CCI that tracks market trends, identifies potential reversals, and provides visual trend confirmation through adaptive trailing stops and color-coded alerts.
A trendline is a technical analysis tool that visually represents market direction by connecting significant price pivots, helping traders identify support, resistance, and potential entry and exit points.
A sophisticated technical analysis tool combining RSI, Discontinued Signal Lines, and ZLEMA to identify market trends, momentum, and potential reversals with adaptive signal generation.
Likes, views, and comments are historical TradingView snapshots. They describe attention, not trading performance.