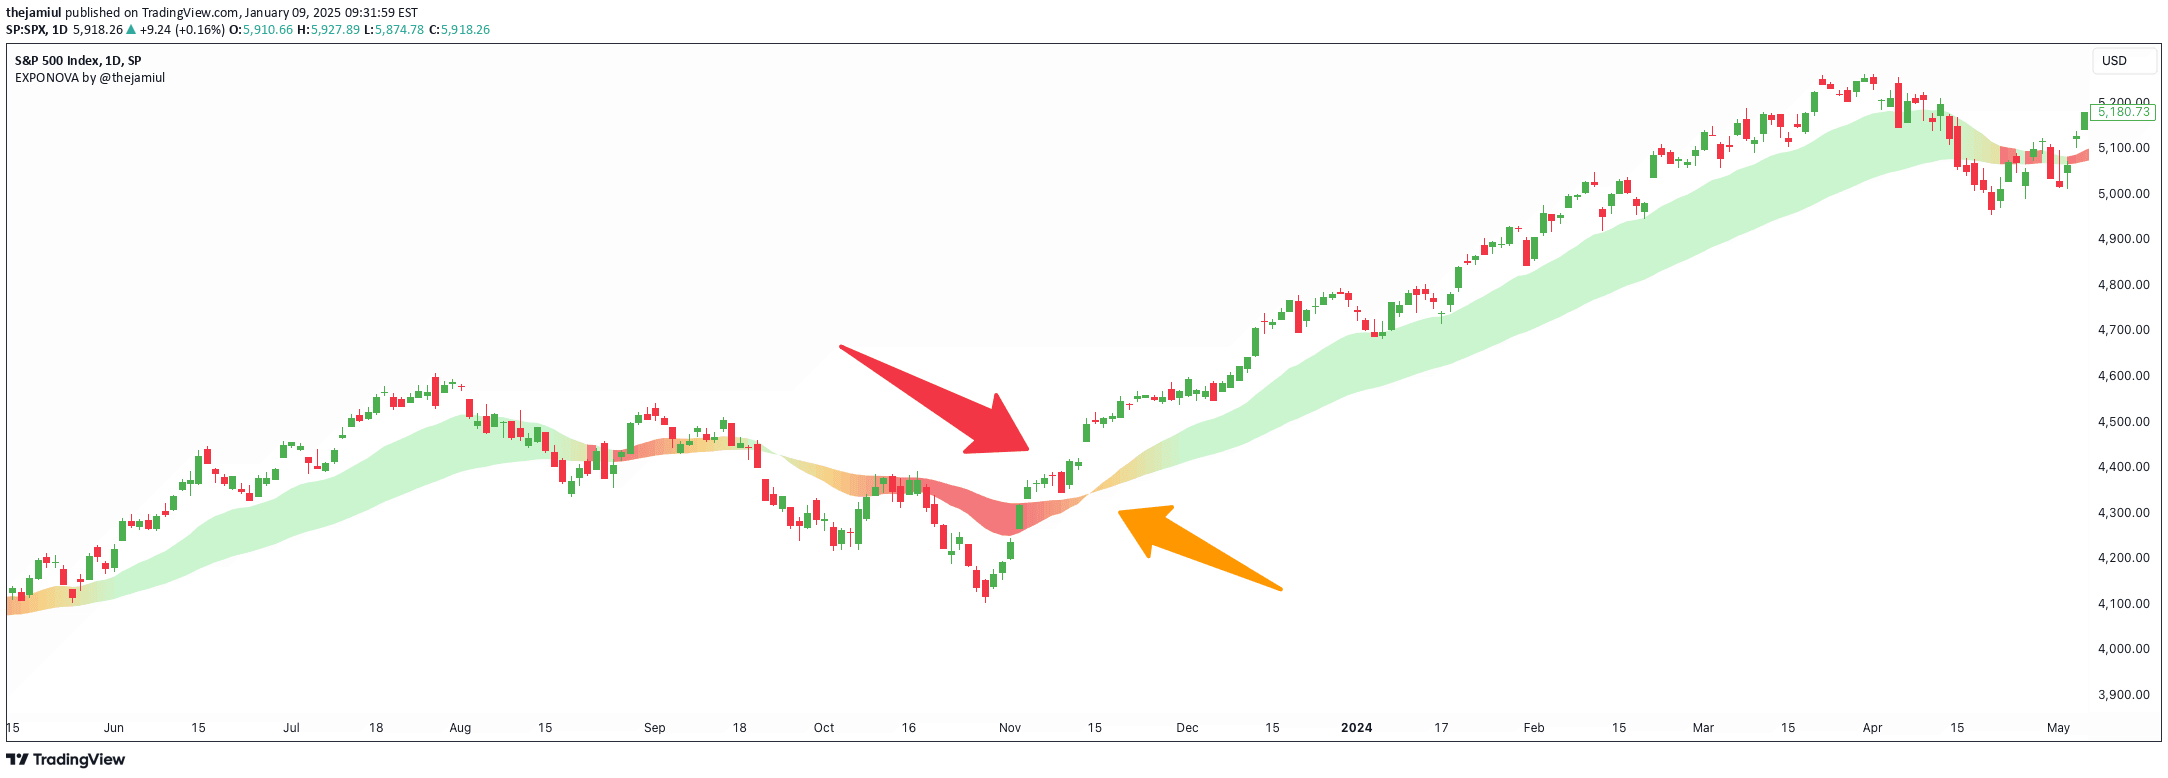
An advanced trend detection tool that uses EMA crossovers to identify market flow, dynamic price levels, and trend momentum with visual gradient bands.
Explore complementary indicator rolesHow it works
The Market Trend Levels Detector operates by tracking the interaction between fast and slow exponential moving averages (EMAs) to detect trend shifts. When the fast EMA crosses above or below the slow EMA, the indicator identifies and marks the most recent local high or low points, creating horizontal price levels.
These detected levels are dynamically extended until price crosses them, providing traders with visual markers of significant price zones. The indicator simultaneously generates a gradient trend band between the two EMAs, with color intensity varying based on market volatility and trend strength.
Why it may be useful
This tool provides traders with a comprehensive visual representation of market dynamics, helping them quickly understand trend direction and strength. By mapping key price levels and offering intuitive color-coded trend visualization, it simplifies complex market analysis and reduces interpretation time.
The gradient trend band and dynamic level detection allow traders to quickly identify potential entry and exit points, assess trend momentum, and recognize possible trend reversals or continuation patterns across different trading timeframes.
When to explore it
The Market Trend Levels Detector is most effective in trending markets with clear directional movements, where EMA crossovers can reliably signal momentum shifts. It works exceptionally well in liquid markets like forex, stocks, and major cryptocurrency pairs that exhibit consistent trending behavior.
Traders should utilize this tool during periods of stable market conditions, avoiding its use during extreme market volatility or choppy, range-bound markets where trend signals might generate false indicators. It's particularly valuable for traders seeking a comprehensive, visually intuitive approach to trend analysis.
Keep exploring
What we’ve verified
Access, alerts and repainting behaviour have not been independently verified for this indicator. Check the creator’s current publication and settings.
General descriptions and classifications are recovered research. Verified details above identify the specific checks we have completed. Check the creator’s current publication for later changes.