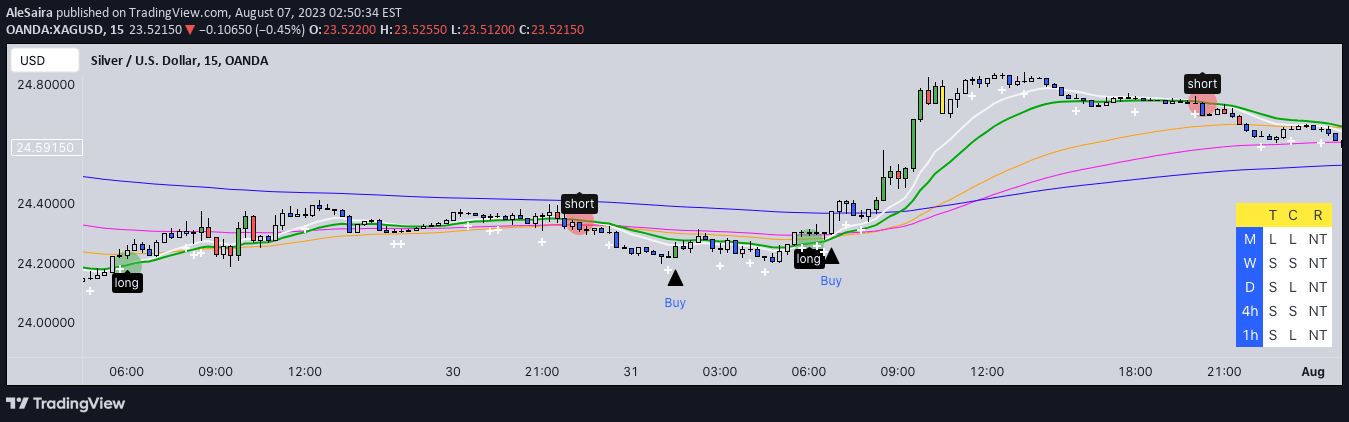
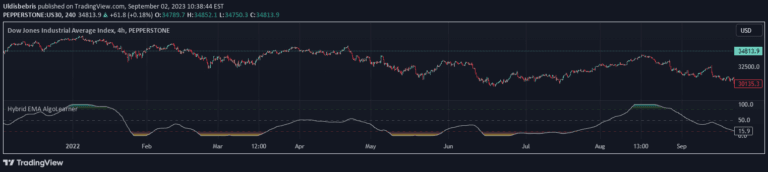
Market Trend Levels Detector [BigBeluga]
An advanced trend detection tool that uses EMA crossovers to identify market flow, dynamic price levels, and trend momentum with visual gradient bands.
Explore 11,183 indicators. Filter beyond the obvious.
Discover the tools that fit the way you trade.
11,183 tools to explore
An advanced trend detection tool that uses EMA crossovers to identify market flow, dynamic price levels, and trend momentum with visual gradient bands.
A comprehensive trading indicator that combines multiple technical analysis tools like EMA crossovers, candle patterns, trend directions, and RSI to provide multi-timeframe trading insights.
A flexible EMA cross dashboard that enables traders to analyze exponential moving average crosses across multiple timeframes with customizable settings and sources.
A sophisticated statistical arbitrage tool that uses advanced mathematical techniques to detect potential market reversals by analyzing EMA relationships and statistical spread dynamics.
A trading tool that measures Maximum Favorable Excursion (MFE) and Maximum Adverse Excursion (MAE) to evaluate signal quality and potential stop-loss and take-profit levels.
A multi-timeframe EMA indicator that analyzes market trends across short, medium, and long-term perspectives, providing comprehensive insights into potential trading opportunities.
A unique trading indicator blending k-NN-inspired algorithmic approach with EMAs to generate more nuanced market analysis through weighted short-term EMA calculations.
A trading signal that uses RSI, EMA crossovers, and triangular indicators to generate long and short alerts on the daily timeframe for swing trading strategies.
An EMA Short Long indicator using three exponential moving averages to generate buy and sell signals by tracking crossovers between EMA lines and a signal line.
Advanced Chandelier Exit indicator that combines trend-following logic with ATR-based stop levels, providing filtered buy and sell signals using multiple EMA confirmations.
Dee_EMA 5.0 is an advanced EMA indicator that displays multiple exponential moving average values across different time frames in a single, easy-to-read table.
A comprehensive trend analysis tool using five customizable Exponential Moving Averages (EMAs) to provide multi-timeframe insights into market direction and potential trading signals.
Likes, views, and comments are historical TradingView snapshots. They describe attention, not trading performance.