Buy/Sell EMA Candle
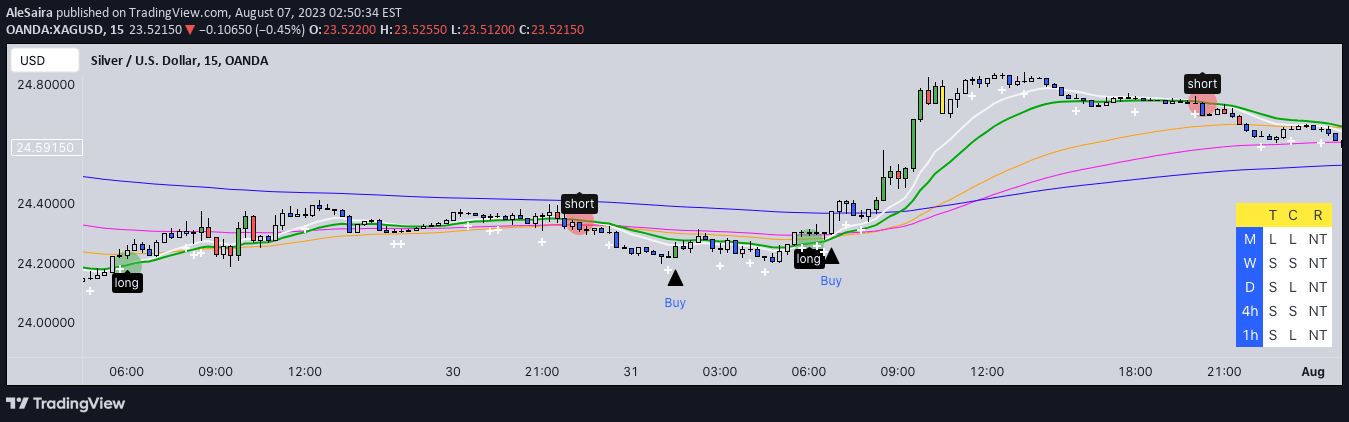
A comprehensive trading indicator that combines multiple technical analysis tools like EMA crossovers, candle patterns, trend directions, and RSI to provide multi-timeframe trading insights.
Explore 11,183 indicators. Filter beyond the obvious.
Discover the tools that fit the way you trade.
11,183 tools to explore
A comprehensive trading indicator that combines multiple technical analysis tools like EMA crossovers, candle patterns, trend directions, and RSI to provide multi-timeframe trading insights.
A trend line indicator that plots multiple support and resistance lines to identify potential market reversals and crossover trading opportunities across different timeframes.
A market analysis tool revealing liquidity pools through significant price candle wicks, highlighting potential manipulation zones and important support/resistance areas across different timeframes.
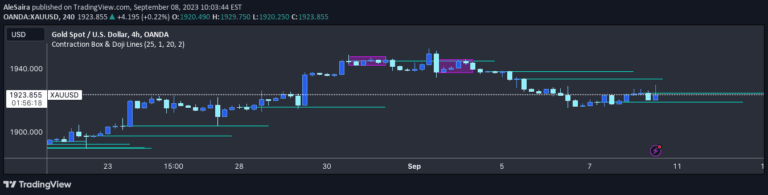
A technical indicator that identifies doji candlestick patterns and price contraction zones, highlighting potential support and resistance levels to help traders anticipate market movements.
An indicator that identifies market contraction by detecting embedded candlesticks and drawing a rectangle highlighting potential price movement zones with a critical midline.
A trading indicator that identifies potential buy and sell signals by creating rectangles around doji candlesticks and tracking price movements relative to these zones.
Hull Waves indicator uses Hull Moving Averages to identify market trends and potential entry/exit points by analyzing price movements through dynamic visual lines and moving average crossovers.
VWAP is a volume-weighted average price indicator that smooths price data and provides trend insights by analyzing price movement relative to trading volume.
A technical indicator that identifies Engulfing candlestick patterns relative to the 200 EMA, highlighting potential trend reversals and providing visual cues for trading decisions.
A trading signal using exponential moving averages that generates visual cues through colored triangles and vertical bars to identify potential market entry points and trend directions.
Likes, views, and comments are historical TradingView snapshots. They describe attention, not trading performance.