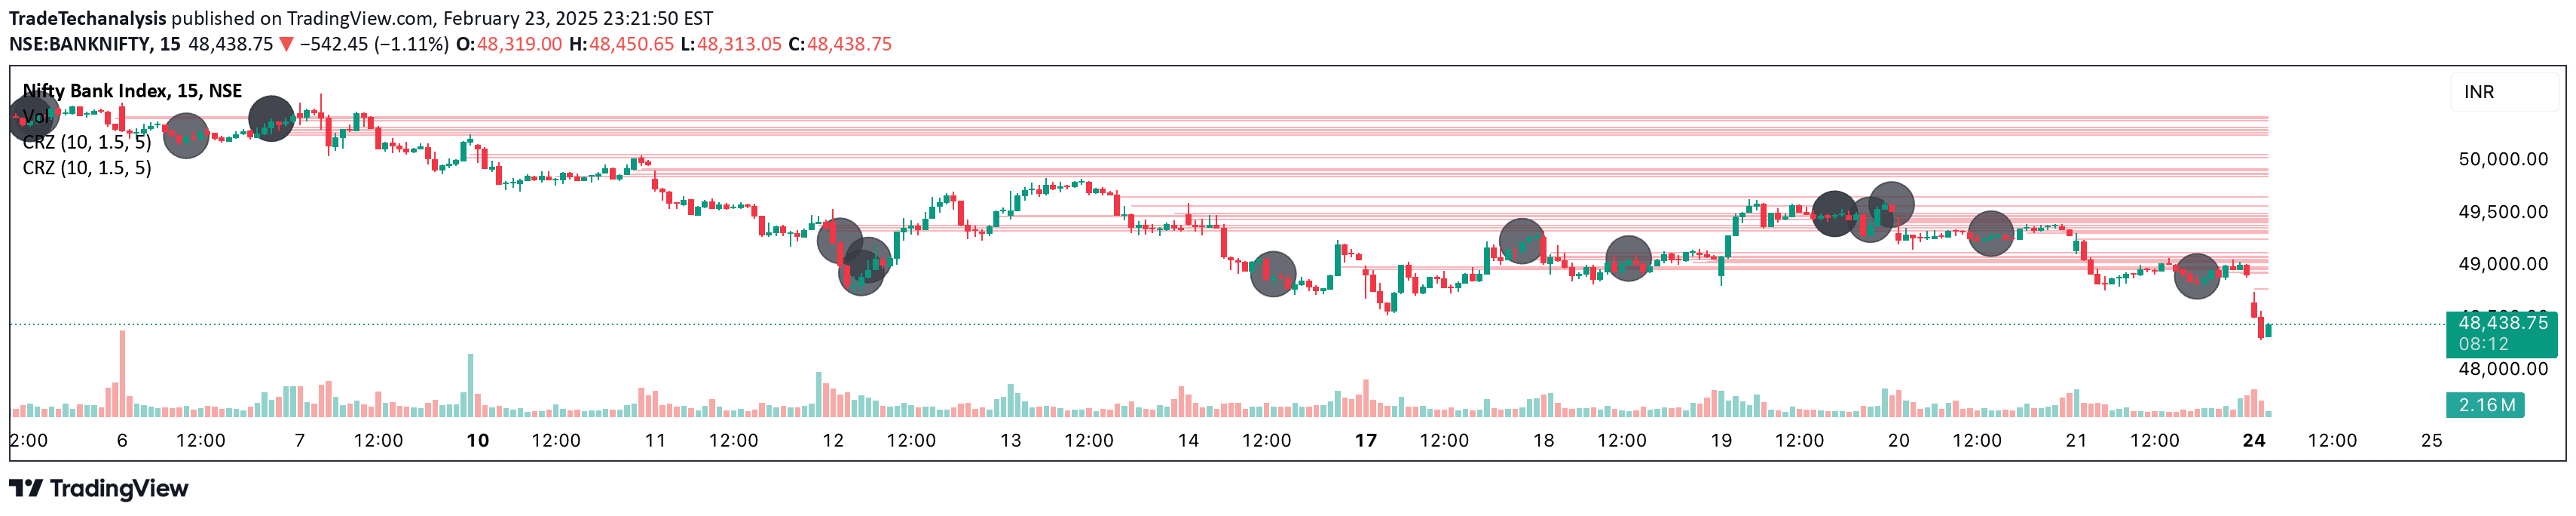
A technical indicator that identifies doji candlestick patterns and price contraction zones, highlighting potential support and resistance levels to help traders anticipate market movements.
Explore complementary indicator rolesHow it works
The Contraction & Doji Lines indicator first identifies doji candlestick patterns, which represent market indecision, by detecting specific candle formations. From these doji candles, it draws horizontal lines at the middle of their bodies, extending to the right side of the chart to represent potential support or resistance levels.
Simultaneously, the indicator analyzes price contraction zones by identifying periods of narrow price ranges. It draws colored boxes spanning from five bars ago to the current bar, encompassing the highest high and lowest low of the detected zone. Traders can customize the box's color, border color, and width to suit their visual preferences.
Why it may be useful
The indicator provides traders with visual cues about potential market turning points and areas of price compression. By highlighting doji patterns, it reveals moments of market uncertainty where bulls and bears are in equilibrium, which can precede significant price movements.
The price contraction zone boxes are particularly valuable as they identify periods of reduced volatility that often signal upcoming breakouts or breakdowns. These zones help traders anticipate potential directional changes and prepare entry or exit strategies based on the expected price movement.
When to explore it
The Contraction & Doji Lines indicator is most effective in markets with clear price patterns and moderate volatility. Traders should use it when looking to identify potential support and resistance levels, especially during periods of market consolidation or when seeking early signals of trend reversals.
It works best when combined with other technical analysis tools to confirm signals. Traders can use the doji lines and contraction zones as part of a comprehensive trading strategy, looking for additional confirmation from volume, trend indicators, or other pattern recognition tools before making trading decisions.
Keep exploring
What we’ve verified
Access, alerts and repainting behaviour have not been independently verified for this indicator. Check the creator’s current publication and settings.
General descriptions and classifications are recovered research. Verified details above identify the specific checks we have completed. Check the creator’s current publication for later changes.