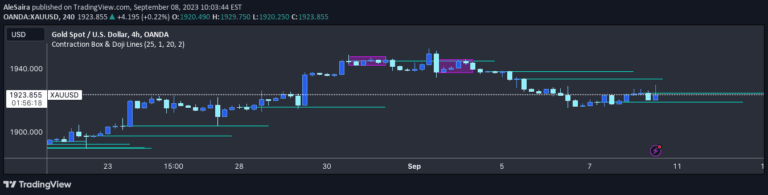
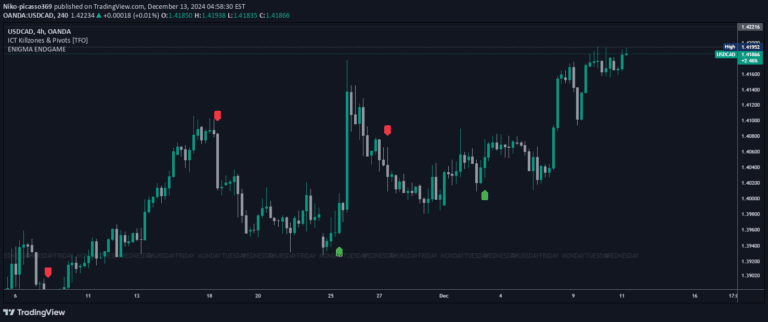
A trading signal that identifies potential support levels by analyzing price consistency across recent candles, creating a clear support line based on precise price clustering conditions.
Explore complementary indicator rolesHow it works
The signal evaluates the last 10 candles to establish a potential support line by examining the low prices, open prices, and closing prices. It checks if these prices are within 3% of each other, which indicates a stable price range and potential support zone.
When the low prices, open prices, and closing prices all meet these tight clustering criteria, a single support line is drawn. This line represents a level where prices have consistently found support and demonstrated minimal variation, suggesting a potential area of price stabilization.
Why it may be useful
This signal helps traders identify potential support zones with high precision by analyzing recent price behavior. By focusing on price consistency within a narrow range, traders can detect areas where the market has demonstrated stability and potential buying interest.
The method provides a data-driven approach to support level identification, reducing reliance on subjective visual analysis. It offers traders a systematic way to recognize potential entry or exit points based on recent price clustering, which can enhance trading decision-making and risk management strategies.
When to explore it
The signal is most effective in markets experiencing consolidation or moderate volatility, where price movements are relatively contained. It works best in timeframes that allow for sufficient candle data to establish the 10-candle comparison, such as intraday or short-term trading periods.
Traders should apply this signal in markets with consistent price behavior, such as forex, futures, or stocks with stable trading patterns. It is particularly useful for traders seeking precise support levels and wanting to minimize false breakout risks by focusing on statistically significant price clustering.
Keep exploring
What we’ve verified
Access, alerts and repainting behaviour have not been independently verified for this indicator. Check the creator’s current publication and settings.
General descriptions and classifications are recovered research. Verified details above identify the specific checks we have completed. Check the creator’s current publication for later changes.