YOUR INDICATOR RESEARCH STARTS HERE

Find the right indicator.
Understand what it does.

Explore 11,183 indicators. Filter beyond the obvious.
Discover the tools that fit the way you trade.

THE INDICATOR LIBRARY

Results for “contraction”

11,183 tools to explore

78 indicators matching your filters
Save search
TrendVolatilityChannels

SuperBollingerTrend (Expo)

by Zeiierman

SuperBollingerTrend combines Bollinger Bands and SuperTrend to analyze market volatility and trend direction, providing traders insights into potential trend changes and breakouts.

Main price chart · unverifiedScalping · Day Trading
Explore
7.8Klikes137.6Kviews57comments
Save
LevelsPatternsSignal

Master Pattern [LuxAlgo]

by LuxAlgo

A trading indicator that detects market contraction phases, identifies major and minor patterns, and highlights potential expansion and markup zones through dynamic lines and levels.

Main price chart · unverifiedScalping · Day Trading
Explore
4.6Klikes141.6Kviews20comments
Save
VolumeTrendSignal

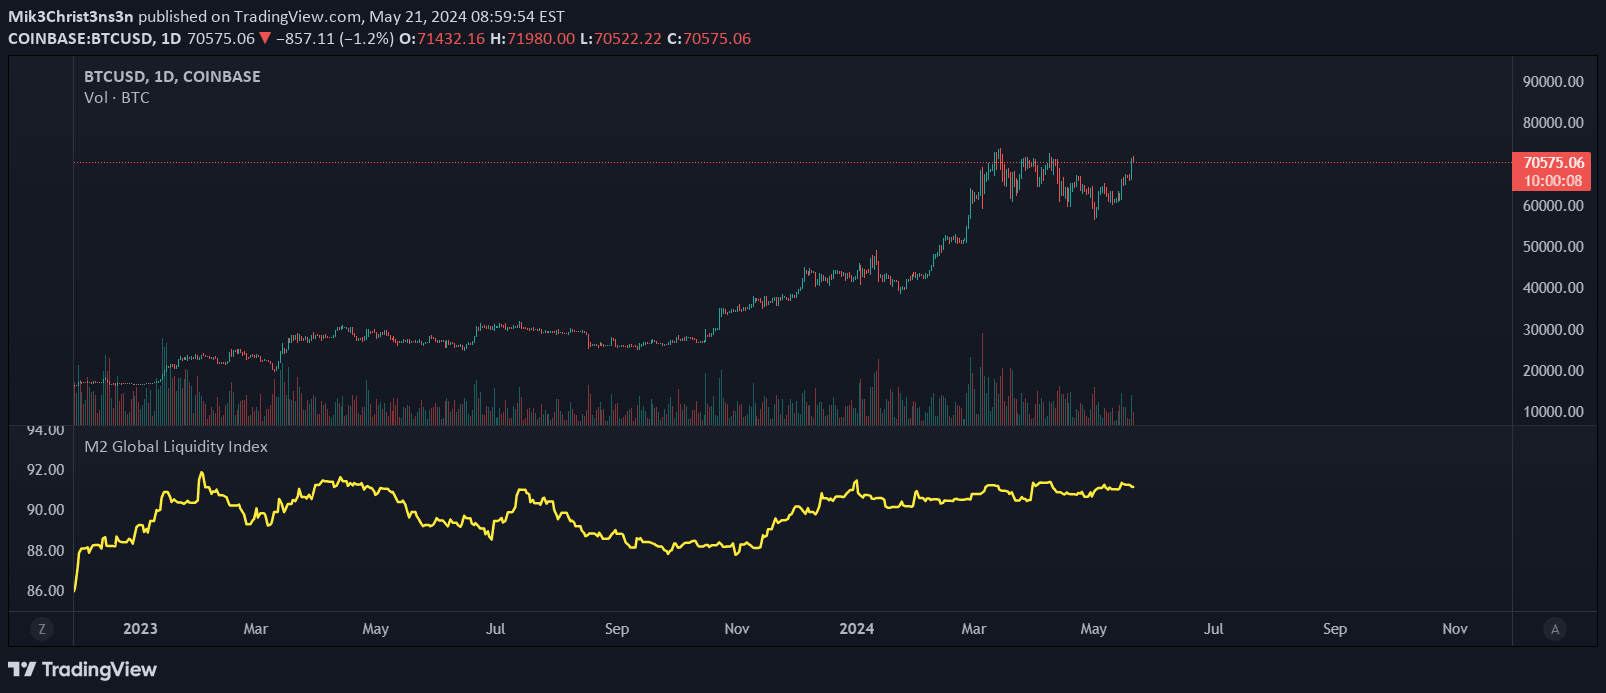
M2 Global Liquidity Index

by Mik3Christ3ns3n

The M2 Global Liquidity Index tracks aggregate money supply across five major currencies, providing a comprehensive view of global economic liquidity and potential market trends.

Separate pane · unverifiedSwing Trading
Explore
2.8Klikes72.7Kviews0comments
Save
TrendVolatilityEditor’s pick

SPY Expected Move by VIX

by AlgoXOR

A volatility indicator using VIX to measure price deviation from VWAP, primarily designed for SPY. It calculates standard deviation moves based on implied volatility, helping traders understand potential price ranges.

Main price chart · unverifiedDay Trading · Swing Trading
Explore
2.6Klikes52.6Kviews47comments
Save
LevelsSignalTrend

Multi Timeframe Market Formation [LuxAlgo]

by LuxAlgo

Multi-timeframe market formation tool that analyzes up to 6 different timeframes simultaneously, revealing market structure, support/resistance levels, and synchronization across time periods.

Main price chart · unverifiedScalping · Day Trading
Explore
2.6Klikes43.5Kviews12comments
Save
ChannelsVolatility

Faytterro Bands

by faytterro

Faytterro Bands are a channel indicator similar to Bollinger Bands, using weighted moving averages and standard deviations to identify market price zones.

Main price chart · unverifiedScalping · Day Trading
Explore
1.9Klikes46Kviews144comments
Save
VolatilitySignalLevels

Candle Range Detector [UAlgo]

by UAlgo

A Pine Script indicator that identifies price consolidation and potential breakouts by analyzing candle ranges, calculating take profit and stop loss levels dynamically.

Main price chart · unverifiedScalping · Day Trading
Explore
1Klikes19.6Kviews6comments
Save
VolumeTrend

Global Liquidity Index (Candles)

by KevinSvenson_

Global Liquidity Index tracks central bank balance sheets worldwide, converting values to USD to provide a comprehensive view of global economic liquidity and monetary conditions.

Separate pane · unverifiedDay Trading · Swing Trading
Explore
1Klikes30.8Kviews5comments
Save
TrendMomentumEditor’s pick

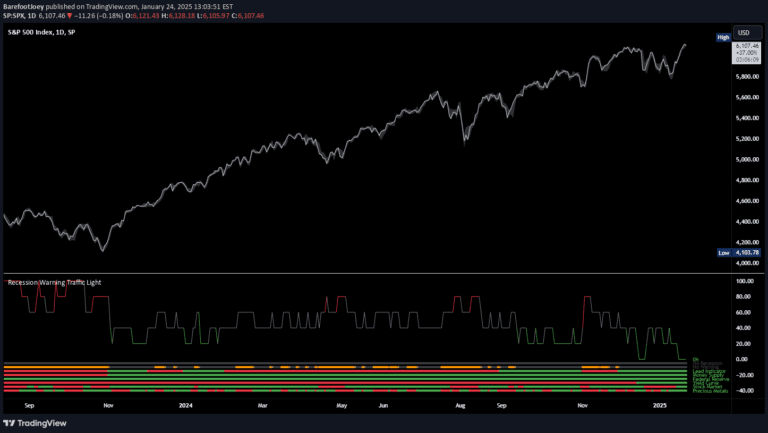
Recession Warning Traffic Light

by BarefootJoey

A multi-metric recession probability indicator using six key economic factors to assess potential economic downturns by analyzing various financial and market signals.

Separate pane · unverifiedSwing Trading
Explore
905likes35.6Kviews27comments
Save
TrendVolatility

Volatility Trend (Zeiierman)

by Zeiierman

A dynamic trend indicator that uses weighted moving averages and volatility bands to help traders identify market direction, potential reversals, and assess price volatility.

Main price chart · unverifiedScalping · Day Trading
Explore
660likes20.2Kviews8comments
Save

Likes, views, and comments are historical TradingView snapshots. They describe attention, not trading performance.

START WITH A QUESTION

A little less searching.
A lot more understanding.

Tell DeepAlpha what you need. Get an explanation, a shortlist,
and a direct path to the indicators behind it.

Ask DeepAlpha