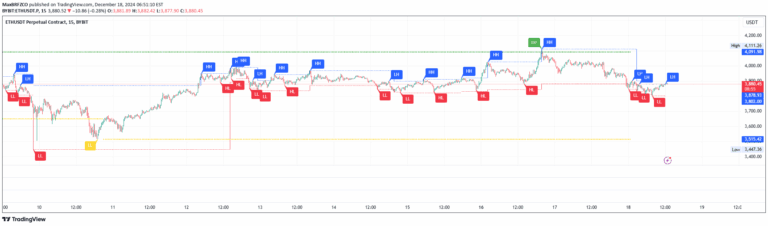
A volatility-based indicator that identifies price contraction periods by analyzing band narrowing and price behavior, signaling potential upcoming market movements.
Explore complementary indicator rolesHow it works
The indicator tracks price movement through volatility bands, monitoring the width and behavior of these bands. When price is written in blue, it suggests decreasing overall volatility. As the outer bands begin to fatten up in blue, a contraction signal forms, indicating a potential market compression.
The bands can be customized to different lengths, allowing flexibility in analysis. By observing the narrowing and widening of these bands, traders can identify periods of reduced market activity and potential upcoming price breakouts
Why it may be useful
This indicator helps traders anticipate potential market movements by highlighting periods of price compression. By identifying volatility contractions, traders can prepare for potential breakouts or trend reversals. The visual representation makes it easy to recognize changing market dynamics quickly.
It provides insight into market sentiment and potential momentum shifts. The adaptable nature of the bands allows for personalized analysis across different trading styles and assets. Understanding these volatility patterns can help traders make more informed entry and exit decisions
When to explore it
The indicator works best during periods of market consolidation and potential trend reversals. It is particularly useful in markets showing signs of reduced volatility or prior to significant economic events. Traders should use it in conjunction with other technical indicators to confirm signals.
It is most effective in markets with clear trend structures and measurable price movements. The indicator can be applied across various financial instruments, including stocks, forex, and cryptocurrencies. Careful interpretation and complementary analysis are crucial for successful trading
Keep exploring
What we’ve verified
Access, alerts and repainting behaviour have not been independently verified for this indicator. Check the creator’s current publication and settings.
General descriptions and classifications are recovered research. Verified details above identify the specific checks we have completed. Check the creator’s current publication for later changes.