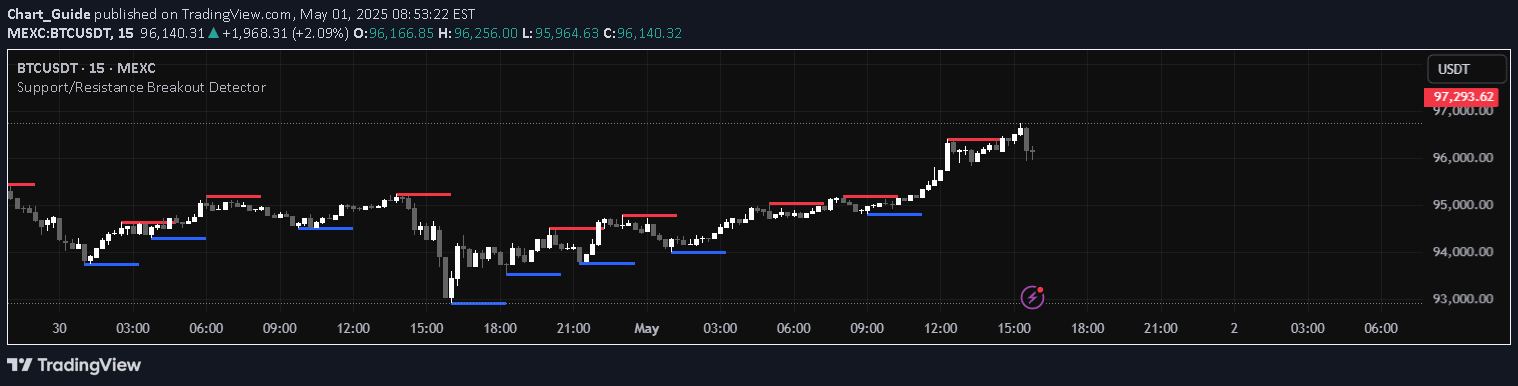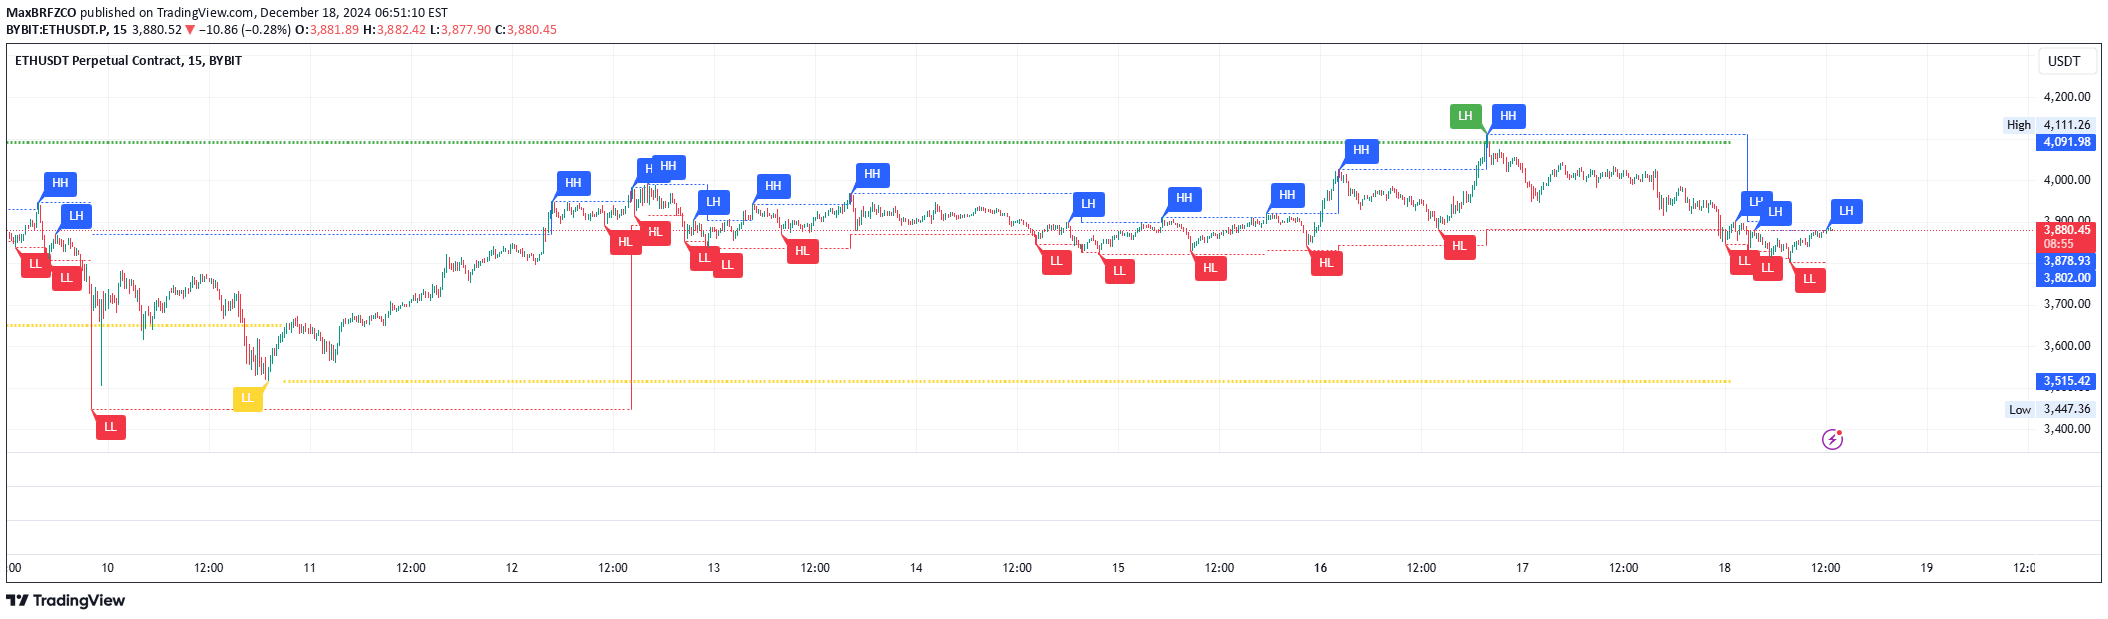
A dynamic market structure indicator that identifies trend shifts by tracking price action through unique swing high and low detection, providing real-time support and resistance levels.
Explore complementary indicator rolesHow it works
The Market Structure indicator dynamically updates resistance and support levels by analyzing price action without relying on fixed lookback periods. It identifies significant market levels by observing when closing prices break above previous highs or below previous lows, creating a flexible and adaptive tracking mechanism.
The indicator uses a configurable confirmation parameter to refine swing point detection, ensuring precision in identifying true market structural changes. By focusing on confirmed breakouts and marking structural points like Higher Highs, Lower Highs, Lower Lows, and Higher Lows, the tool provides a comprehensive view of evolving market trends.
Why it may be useful
The Market Structure indicator offers traders a sophisticated method of understanding market dynamics by eliminating arbitrary inputs and focusing solely on meaningful price action. Its unique approach provides clear, noise-free analysis that adapts seamlessly across different financial instruments and timeframes, giving traders a more reliable framework for decision-making.
By dynamically tracking support and resistance levels, the indicator helps traders identify potential trend reversals, continuations, and key entry and exit points. Its fractal and self-adaptive nature ensures that traders receive accurate, real-time insights into market structure, reducing false signals and enhancing overall trading strategy.
When to explore it
The Market Structure indicator is most effective in markets with clear trending characteristics, where price action shows consistent directional movement. It performs exceptionally well in volatile markets like cryptocurrencies, forex, and stocks, where rapid price changes require dynamic and responsive analysis tools.
Traders should utilize this indicator when seeking to confirm trend strength, identify potential reversal points, and establish precise support and resistance levels. It is particularly valuable during periods of market transition, helping traders distinguish between genuine trend changes and temporary price fluctuations.
Keep exploring
What we’ve verified
Access, alerts and repainting behaviour have not been independently verified for this indicator. Check the creator’s current publication and settings.
General descriptions and classifications are recovered research. Verified details above identify the specific checks we have completed. Check the creator’s current publication for later changes.