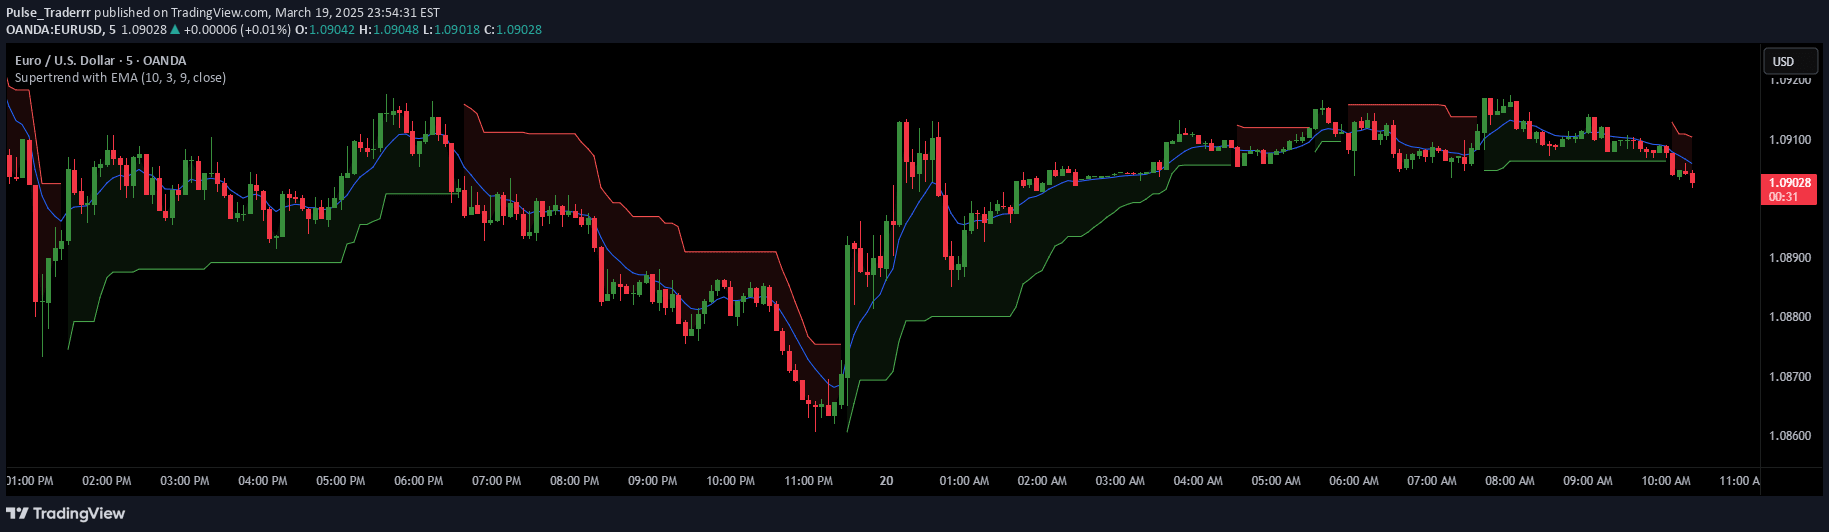
A dynamic rolling daily Simple Moving Average (SMA) with customizable standard deviation bands that automatically adapts to different market instruments and timeframes for trend and volatility analysis.
Explore complementary indicator rolesHow it works
The Rolling Daily SMA With Std Dev Bands works by automatically detecting the trading instrument type and applying the correct daily lookback period based on the chart's timeframe. For futures, it uses full trading day lengths, while for US stocks, it uses regular session lengths, ensuring accurate calculations across different market environments.
The indicator generates a 3-point purple line representing the rolling daily Simple Moving Average, which continuously updates to reflect current market trends. Alongside this, it creates three standard deviation bands with customizable multipliers, allowing traders to adjust the width and visibility of each band to suit their specific trading strategy and market analysis needs.
Why it may be useful
This indicator provides traders with a powerful tool for understanding market dynamics by combining trend analysis and volatility measurement in a single, adaptable visualization. The rolling daily SMA offers an adaptive trend indicator that responds to changing market structures, while the standard deviation bands help identify potential overbought or oversold conditions.
The color-coded inner band area provides instant visual feedback on market momentum, with light green indicating a rising SMA and light red signaling a falling trend. This feature allows traders to quickly interpret market direction and potential trading opportunities without complex manual calculations.
When to explore it
The Rolling Daily SMA With Std Dev Bands is most effective for traders seeking a comprehensive view of market trends and volatility across different timeframes and instruments. It works exceptionally well for short-term trading strategies, particularly on 1-minute, 3-minute, 5-minute, and 15-minute charts, where quick trend identification is crucial.
Traders can leverage this indicator during periods of market uncertainty, using the standard deviation bands to spot potential breakout zones and the rolling SMA to confirm trend direction. It is particularly useful for futures and US stock traders who require a dynamic, adaptable tool that can provide immediate insights into market movements and potential trading opportunities.
Keep exploring
What we’ve verified
Access, alerts and repainting behaviour have not been independently verified for this indicator. Check the creator’s current publication and settings.
General descriptions and classifications are recovered research. Verified details above identify the specific checks we have completed. Check the creator’s current publication for later changes.