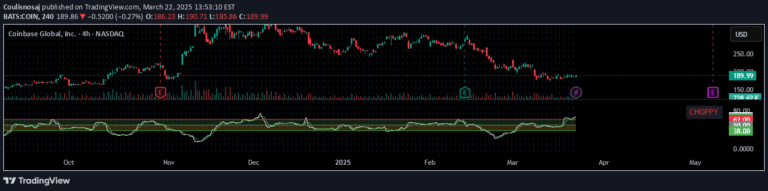
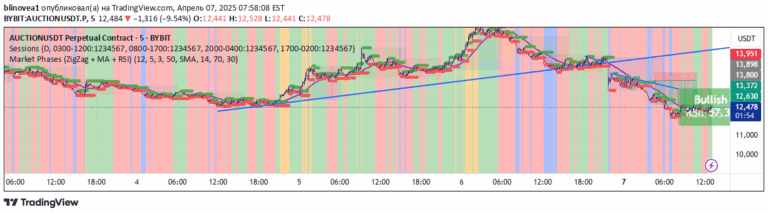
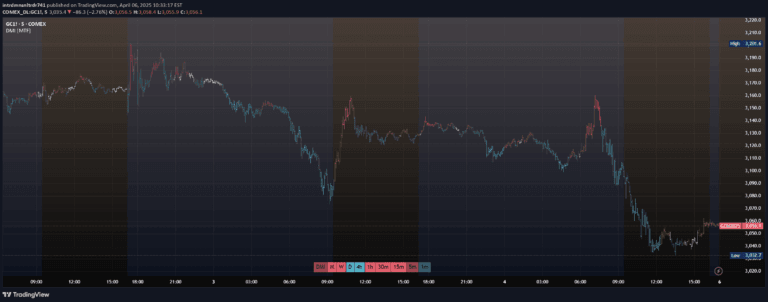
A Choppiness Index indicator that segments market conditions into choppy, trending, and neutral states, helping traders identify market dynamics through precise color-coded visualization.
Explore complementary indicator rolesHow it works
The Choppiness Index calculates market conditions by measuring price range and volatility over a specified length using Average True Range (ATR) and price extremes. It computes a value that indicates whether the market is trending or choppy by analyzing the relationship between price movements and range.
Users can customize the indicator's length and set specific thresholds for defining choppy and trending market states. The script dynamically colors the index plot based on these thresholds, providing a visual representation of market conditions that changes precisely at the defined boundary values.
Why it may be useful
The Choppiness Index helps traders understand market behavior by distinguishing between trending and choppy periods, which is crucial for selecting appropriate trading strategies and managing risk. By providing a clear visual representation of market dynamics, traders can make more informed decisions about entry and exit points.
This indicator reduces subjective interpretation of market conditions by offering an objective, quantitative measure of market state. It allows traders to adapt their approach based on whether the market is exhibiting trending or ranging characteristics, potentially improving trading performance and decision-making.
When to explore it
The Choppiness Index is most effective in markets with varying volatility levels, helping traders identify transitions between trending and choppy conditions. It works well across multiple timeframes, particularly for short to medium-term trading strategies that require quick adaptation to changing market environments.
Traders should use this indicator in conjunction with other technical analysis tools to confirm market signals and validate trading decisions. It is particularly useful during periods of market uncertainty, where distinguishing between trending and ranging markets can provide a significant strategic advantage.
Keep exploring
What we’ve verified
Access, alerts and repainting behaviour have not been independently verified for this indicator. Check the creator’s current publication and settings.
General descriptions and classifications are recovered research. Verified details above identify the specific checks we have completed. Check the creator’s current publication for later changes.