
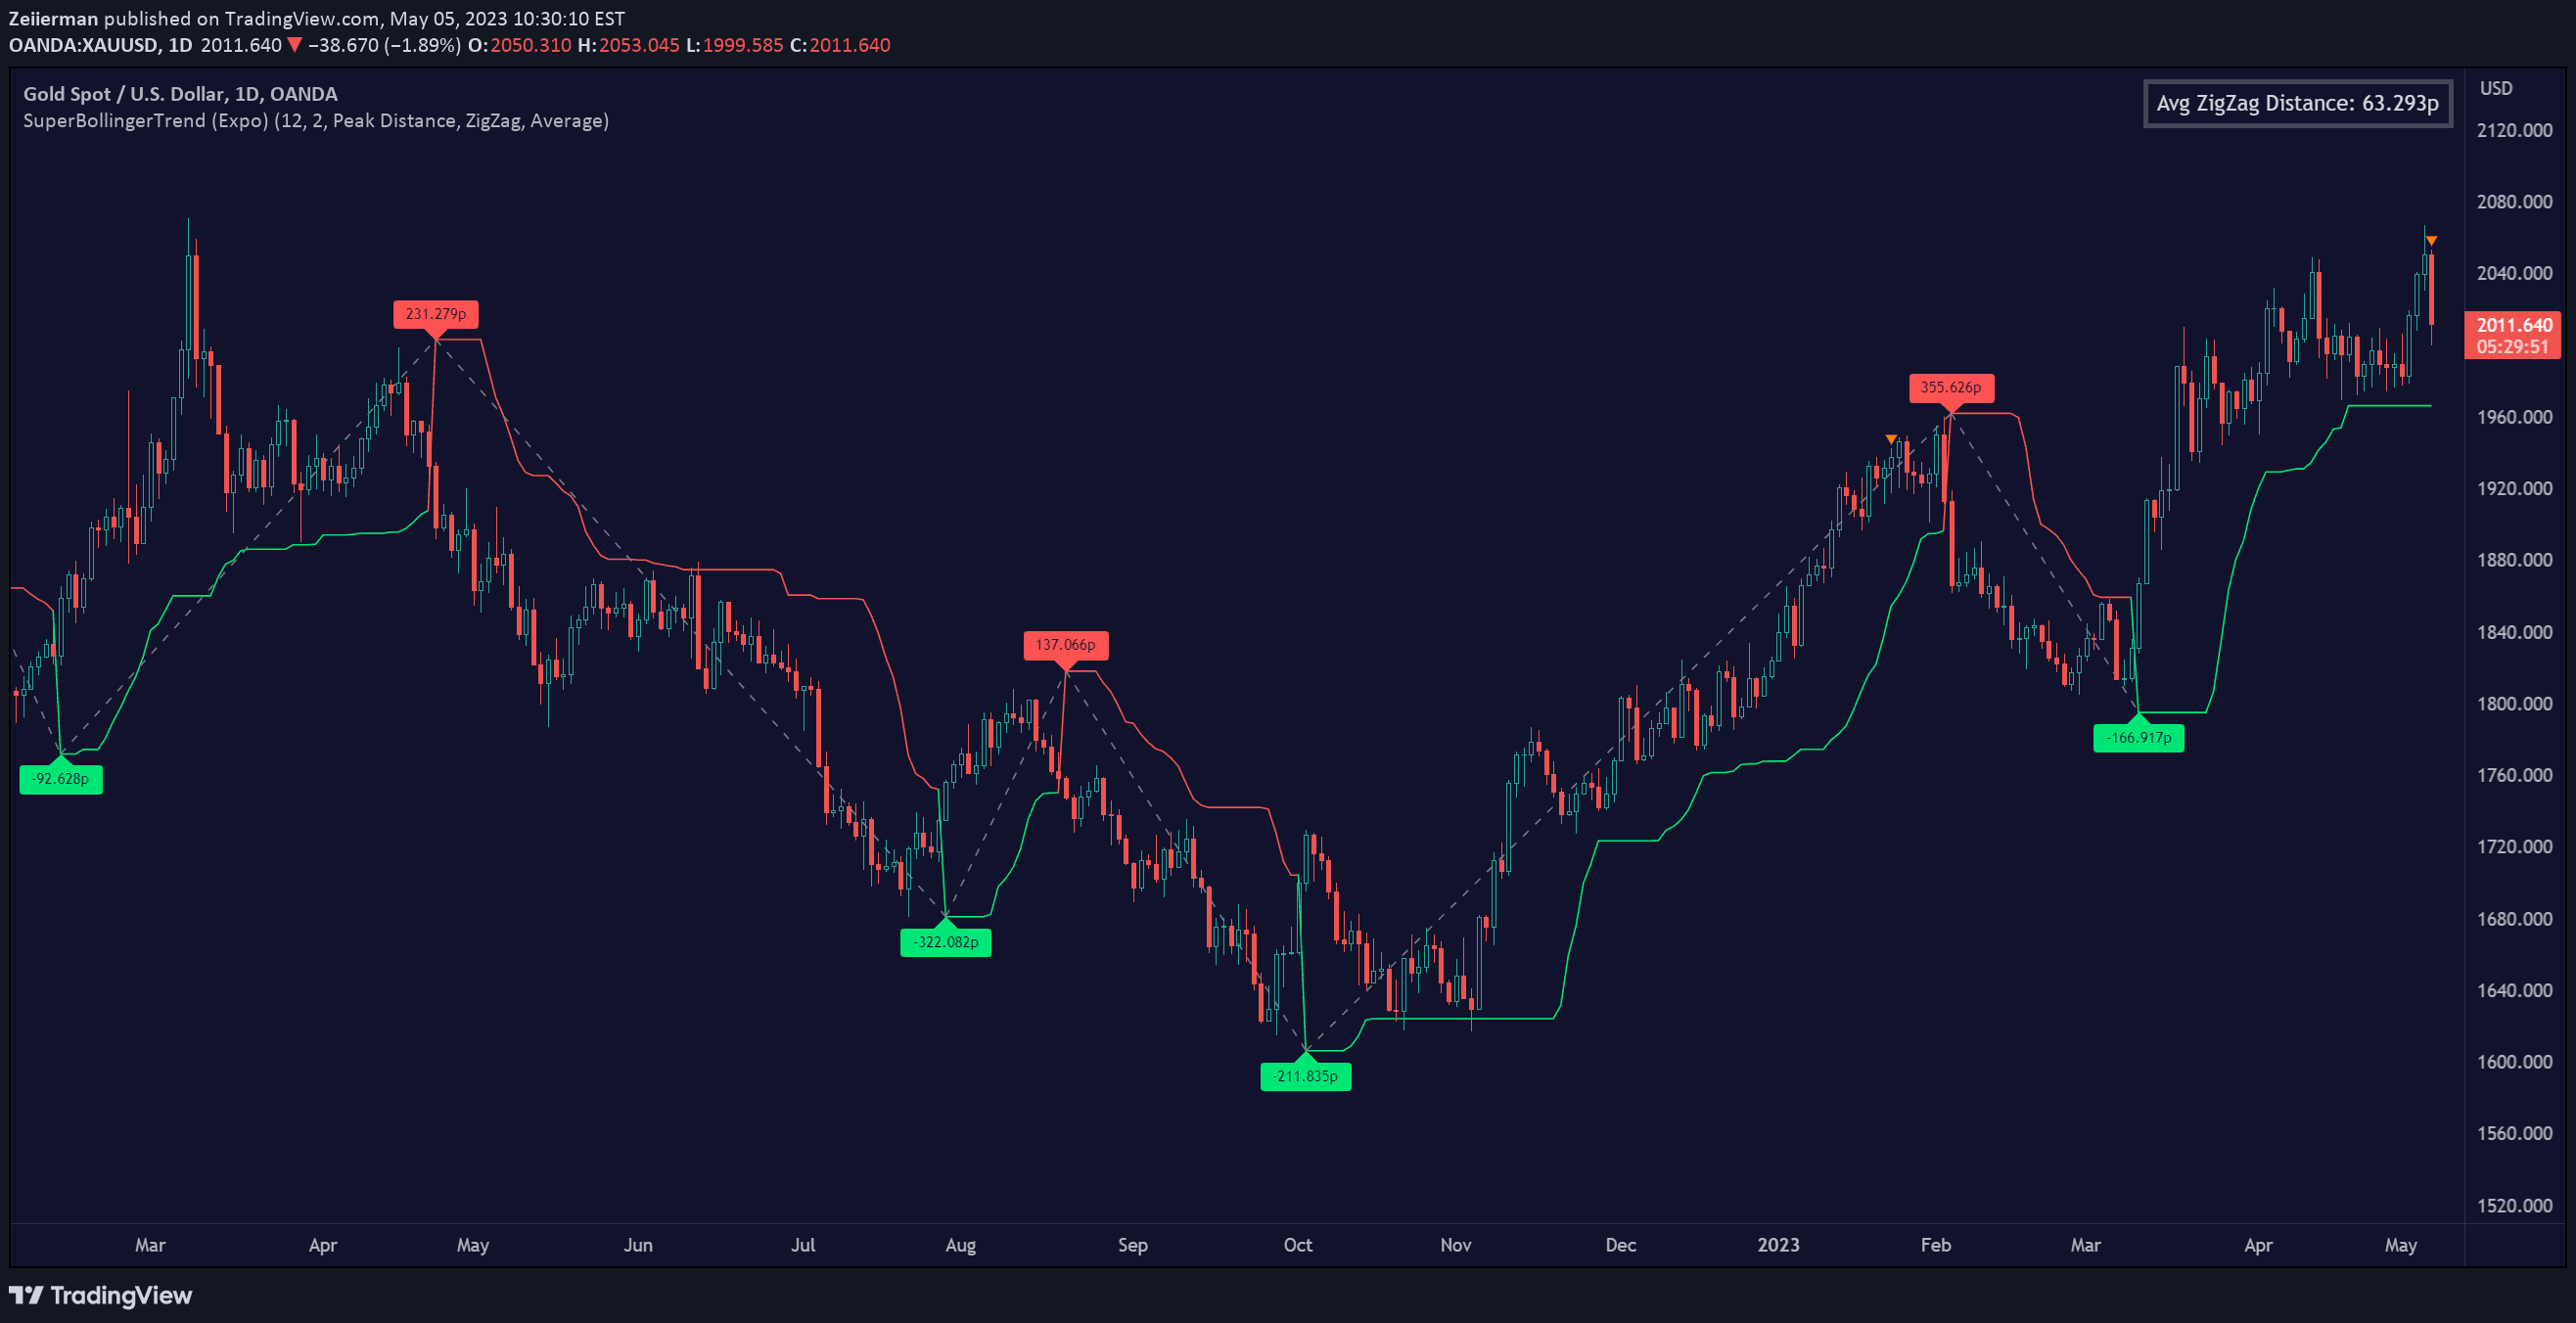
SuperBollingerTrend combines Bollinger Bands and SuperTrend to analyze market volatility and trend direction, providing traders insights into potential trend changes and breakouts.
Explore complementary indicator rolesHow it works
The SuperBollingerTrend indicator integrates Bollinger Bands' volatility measurement with SuperTrend's directional analysis to create a comprehensive market view. It tracks price movements within adaptive bands, identifying potential trend shifts by analyzing volatility expansion and contraction.
By calculating peak price moves and tracking ZigZag signals, the indicator generates dynamic insights into market momentum. It places take profit lines based on average or median price movements, helping traders understand potential trend strengths and likely price ranges.
Why it may be useful
The SuperBollingerTrend provides traders a multi-dimensional view of market dynamics by combining trend identification with volatility analysis. It helps traders recognize potential trend reversals and breakout opportunities by highlighting significant price momentum and market shifts.
By offering visual representations of market volatility and trend direction, this indicator enables more informed trading decisions. Traders can better understand market conditions, manage risk, and identify potential entry and exit points with greater precision.
When to explore it
The SuperBollingerTrend works best during periods of significant market volatility, such as economic announcements, earnings reports, or major market events. It is particularly effective in markets experiencing substantial price swings and potential trend transitions.
Traders should utilize this indicator across multiple timeframes, from short-term scalping to longer-term swing trading strategies. It is most valuable when combined with other technical analysis tools to confirm signals and validate potential trading opportunities.
Keep exploring
What we’ve verified
Access, alerts and repainting behaviour have not been independently verified for this indicator. Check the creator’s current publication and settings.
General descriptions and classifications are recovered research. Verified details above identify the specific checks we have completed. Check the creator’s current publication for later changes.


