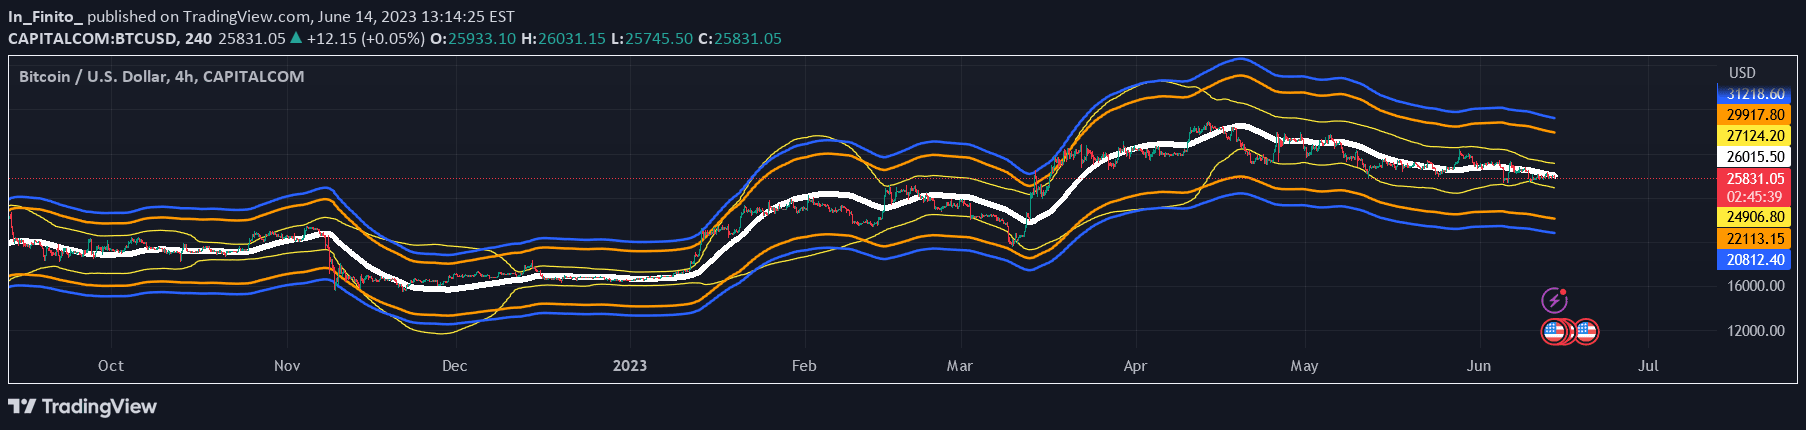
A comprehensive trading strategy combining Bollinger Bands and Supertrend to analyze market volatility and trend direction, providing dynamic support and resistance levels.
Explore complementary indicator rolesHow it works
The Bollinger Bands indicator creates a dynamic price channel using a simple moving average and two standard deviation bands that expand and contract with market volatility. These bands automatically adjust to price movements, providing visual representation of potential support and resistance levels.
The Supertrend indicator complements the Bollinger Bands by using Average True Range to determine trend direction, changing color between green and red to signal bullish or bearish market conditions. When combined, these indicators provide traders with a comprehensive view of market dynamics, helping to identify potential entry and exit points based on both volatility and trend strength.
Why it may be useful
This combined indicator strategy offers traders a more nuanced approach to market analysis by integrating volatility measurement with trend confirmation. By providing visual cues about market conditions, traders can make more informed decisions about potential trade opportunities and market sentiment.
The dynamic nature of Bollinger Bands and Supertrend allows traders to adapt to changing market conditions quickly. This approach reduces the likelihood of false signals by cross-referencing multiple technical analysis components, ultimately improving trade accuracy and risk management.
When to explore it
The Bollinger Bands with Supertrend strategy works best in markets with clear trending behavior and moderate to high volatility. Traders can effectively use this strategy during periods of market movement where price is likely to respect dynamic support and resistance levels.
Ideal application includes identifying potential trend reversals, monitoring breakout opportunities, and confirming market direction across various timeframes. Traders should pay special attention to moments when price approaches Bollinger Band boundaries while Supertrend signals align with the potential trade direction.
Keep exploring
What we’ve verified
Access, alerts and repainting behaviour have not been independently verified for this indicator. Check the creator’s current publication and settings.
General descriptions and classifications are recovered research. Verified details above identify the specific checks we have completed. Check the creator’s current publication for later changes.