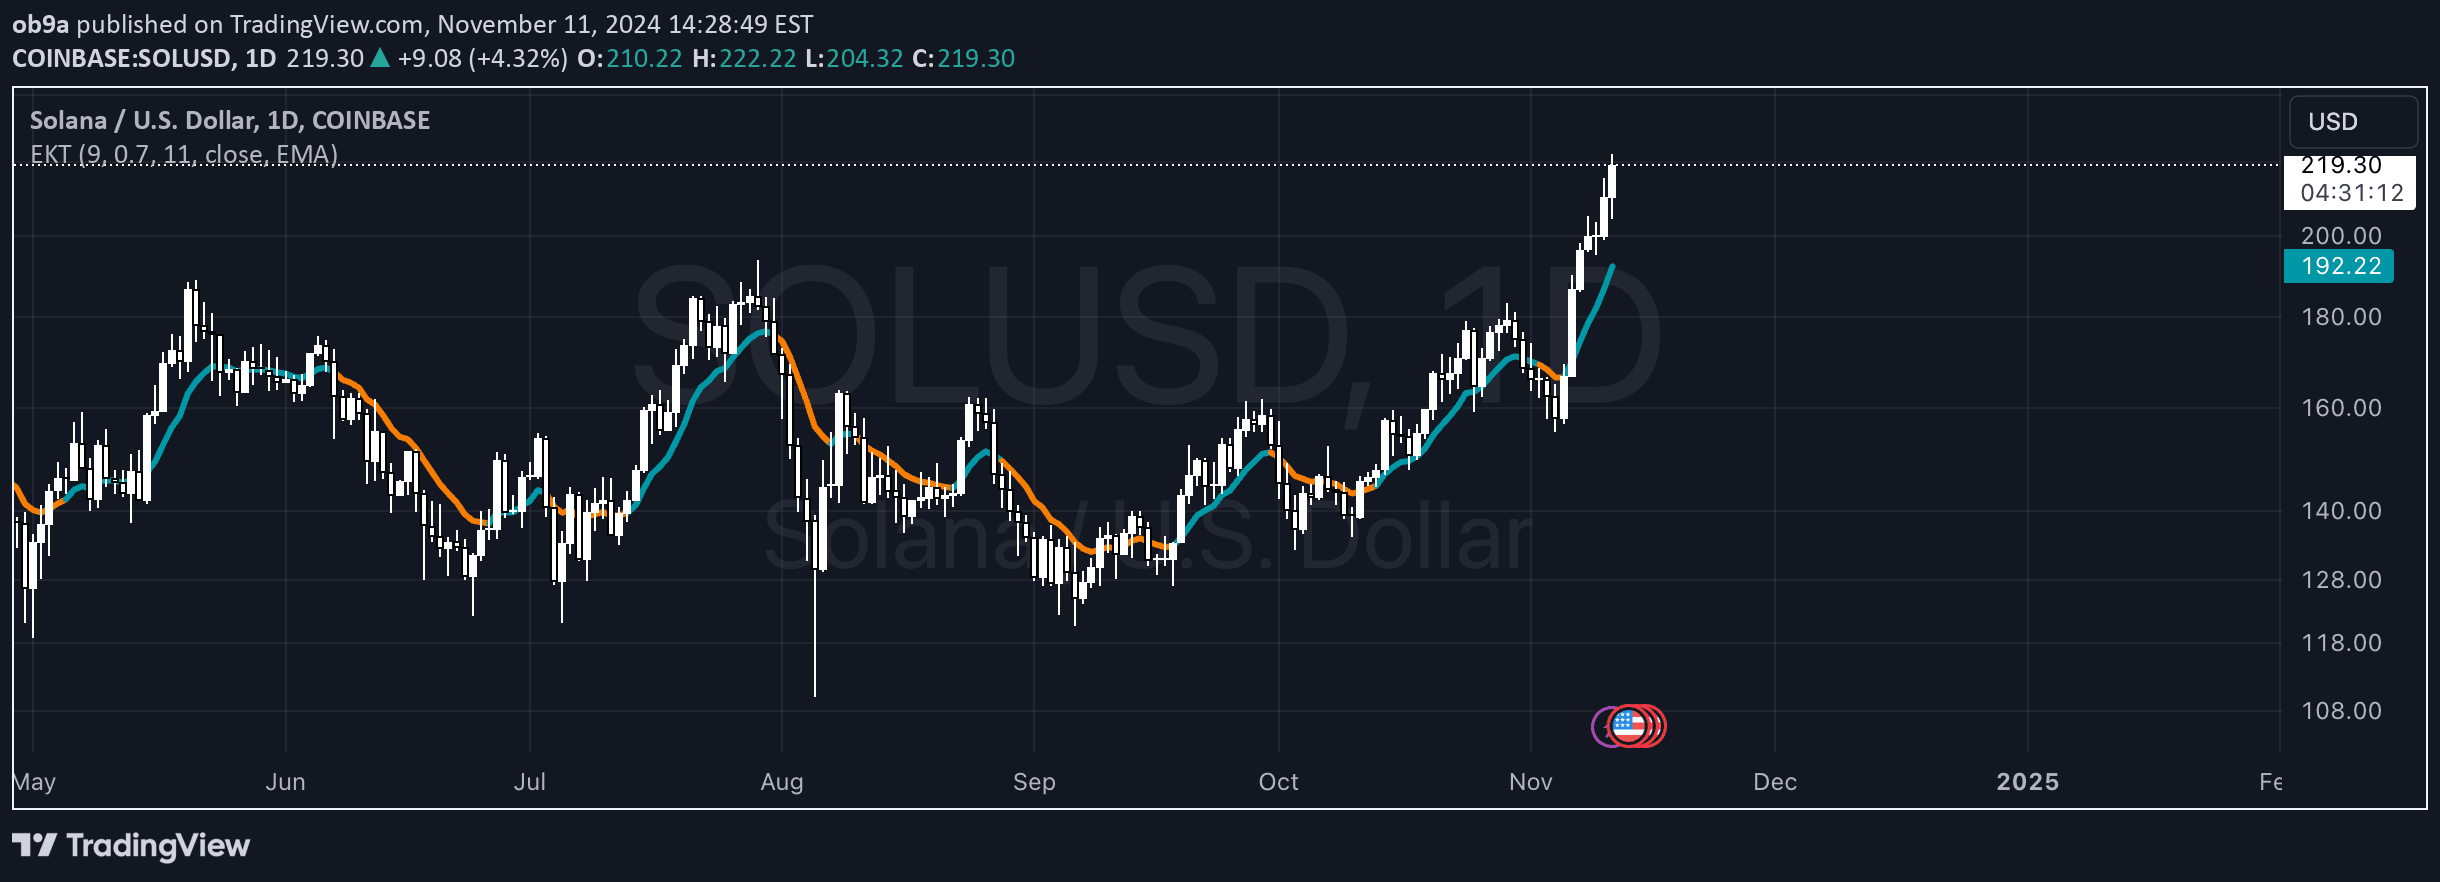
A multitimeframe swing indicator that combines Bollinger Bands and Average True Range to analyze market trends, volatility, and potential entry and exit points across different time frames.
Explore complementary indicator rolesHow it works
The swing indicator operates by integrating Bollinger Bands and Average True Range to assess market conditions across multiple timeframes. It generates signals by analyzing price movements relative to Bollinger Bands' upper and lower limits, categorizing market phases into neutral, bullish, and bearish conditions.
The indicator calculates buy signals when prices drop below the lower Bollinger Band and re-enter the band's range, or during high volatility periods when the Average True Range exceeds its 10-day average. It provides a comprehensive view of market trends by examining price behavior across 1D, 4H, 1H, and 15-minute timeframes, allowing traders to customize their analysis.
Why it may be useful
This indicator is crucial for traders seeking a nuanced understanding of market dynamics by combining trend analysis with volatility measurement. It offers insights into potential market movements by identifying critical price levels and trend transitions, helping traders make more informed decisions about market entry and exit points.
By providing a multitimeframe perspective, the indicator allows traders to understand market conditions beyond single-timeframe analysis. Its ability to categorize market phases and detect high-volatility periods helps traders adapt their strategies, manage risk, and potentially capitalize on emerging market opportunities.
When to explore it
The swing indicator is most effective in markets with clear trending characteristics, particularly during periods of significant price movement and volatility. It works best for traders looking to capture medium-term trends and identify potential entry and exit points across multiple timeframes.
Traders should utilize this indicator when seeking a comprehensive market analysis tool that combines trend and volatility indicators. It is particularly useful for day and swing traders who want to understand market phases, identify potential reversal points, and develop a more strategic approach to trading decisions.
Keep exploring
What we’ve verified
Access, alerts and repainting behaviour have not been independently verified for this indicator. Check the creator’s current publication and settings.
General descriptions and classifications are recovered research. Verified details above identify the specific checks we have completed. Check the creator’s current publication for later changes.