
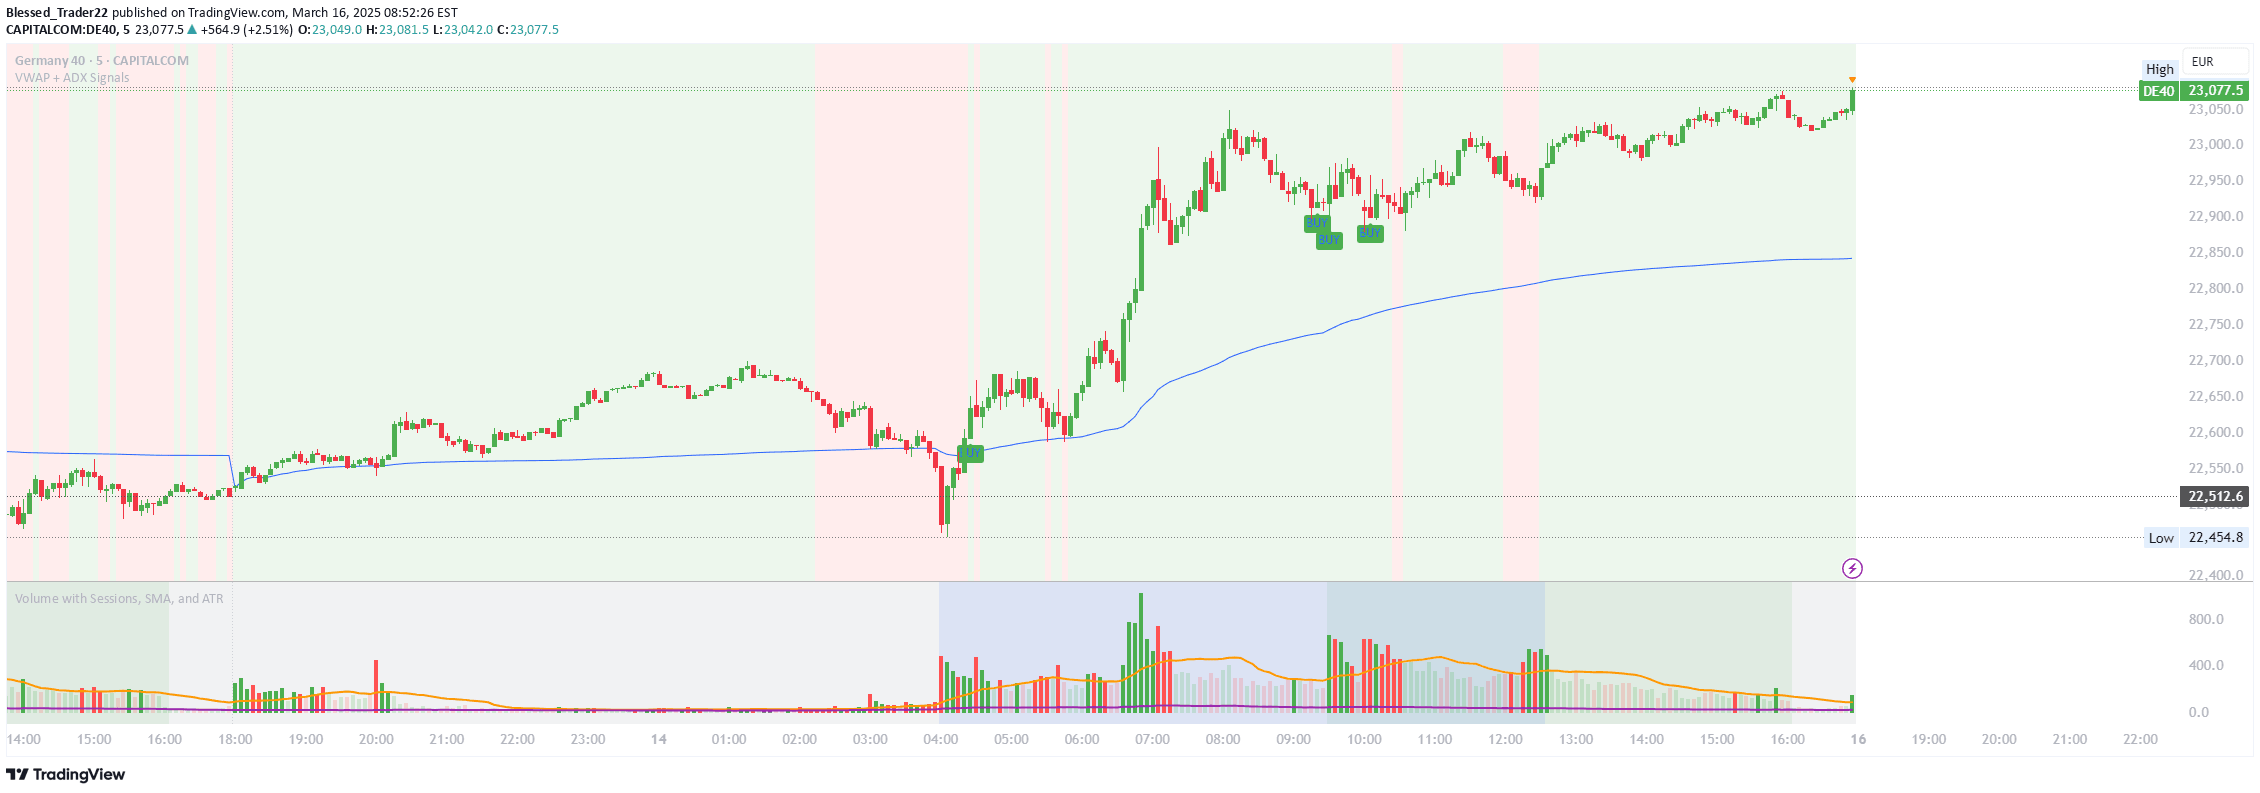
A multi-indicator trading strategy combining ADX trend strength, VWAP, and 50-period SMA to generate buy and sell signals with contextual market trend visualization.
Explore complementary indicator rolesHow it works
The strategy begins by calculating the Average Directional Index (ADX) to measure trend strength and direction using the Directional Movement Index (DMI). It identifies trend shifts by monitoring the crossover points between positive and negative directional indicators. Simultaneously, the Volume Weighted Average Price (VWAP) is computed to establish a benchmark price level based on trading volume and typical price.
The script generates trading signals by combining multiple conditions: ADX must exceed 20 to confirm a strong trend, and price must be positioned relative to the VWAP. Buy signals occur when positive directional indicator crosses above the negative indicator, while sell signals trigger when the opposite crossover happens, providing a comprehensive trend analysis approach.
Why it may be useful
This indicator offers traders a sophisticated, multi-layered market analysis tool that integrates trend strength, volume-weighted pricing, and directional momentum into a single comprehensive view. By combining different technical indicators, traders can gain deeper insights into market dynamics, reducing the likelihood of false signals and improving decision-making precision.
The visual elements, such as background color changes based on price relative to the 50-period SMA and VWAP bands, provide immediate visual context about market conditions. These additional layers help traders quickly understand trend direction, momentum, and potential support/resistance levels, enabling more informed and strategic trading decisions.
When to explore it
This strategy is most effective in markets with clear, directional price movements and consistent trading volume, making it ideal for actively traded instruments like major stock indices, forex pairs, and liquid commodities. Traders should prioritize using this indicator during periods of established market trends, where ADX values consistently remain above the 20 threshold, indicating strong directional movement.
The indicator is particularly useful for short to medium-term trading strategies, especially in intraday and swing trading scenarios. Traders should combine this signal with other confirmatory indicators and fundamental analysis to validate potential entry and exit points, recognizing that no single indicator provides foolproof trading recommendations.
Keep exploring
What we’ve verified
Access, alerts and repainting behaviour have not been independently verified for this indicator. Check the creator’s current publication and settings.
General descriptions and classifications are recovered research. Verified details above identify the specific checks we have completed. Check the creator’s current publication for later changes.


