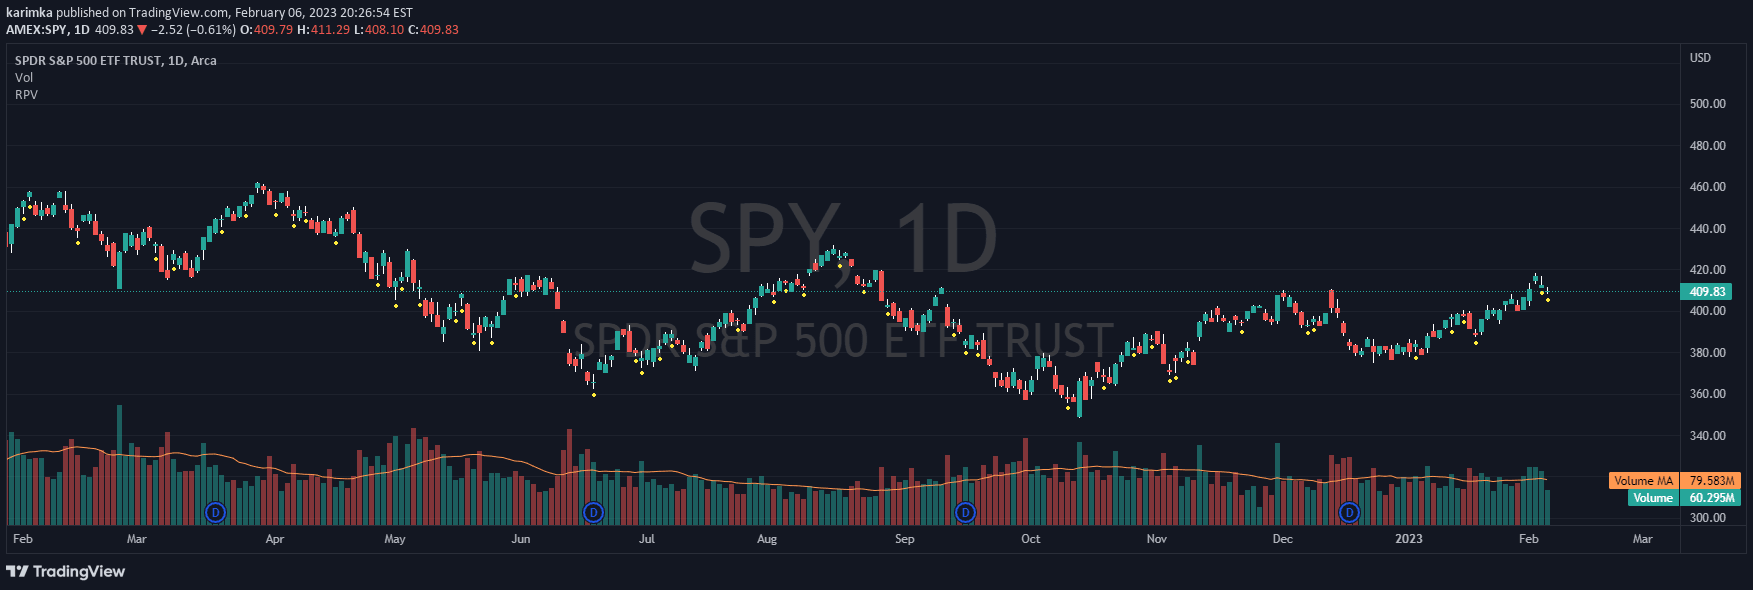
Dollar volume indicator that combines share price and trading volume to provide a more comprehensive view of market liquidity and institutional trading interest.
Explore complementary indicator rolesHow it works
Dollar volume is calculated by multiplying the stock's closing price by its total trading volume for a specific period. This creates a dynamic histogram that visualizes the total monetary value of shares traded, offering a clearer picture of market activity beyond simple share count.
The indicator includes a customizable moving average line (default 20-period) that helps traders quickly identify trends in dollar volume. By formatting the axis in K/M/B notation, the chart remains clean and readable, allowing traders to quickly assess significant trading activity levels.
Why it may be useful
Traditional volume metrics can be misleading, as trading volume alone doesn't capture the full economic impact of market movements. Dollar volume provides a more nuanced view by incorporating both price and trading volume, revealing true market interest and institutional participation.
By translating trading activity into monetary terms, traders can better understand liquidity, validate breakouts, and gauge overall market sentiment. This approach helps distinguish between high-volume movements driven by meaningful institutional trading versus low-impact trading with less significant market implications.
When to explore it
Dollar volume is most effective during periods of significant market activity, such as earnings releases, major news events, or sector-wide movements. It's particularly useful for identifying stocks with genuine institutional interest and confirming the strength of price trends.
Traders should pay special attention to sudden spikes or changes in dollar volume, as these can signal potential trend reversals or confirm existing market momentum. It works best when combined with other technical indicators to provide a comprehensive market analysis strategy.
Keep exploring
What we’ve verified
Access, alerts and repainting behaviour have not been independently verified for this indicator. Check the creator’s current publication and settings.
General descriptions and classifications are recovered research. Verified details above identify the specific checks we have completed. Check the creator’s current publication for later changes.