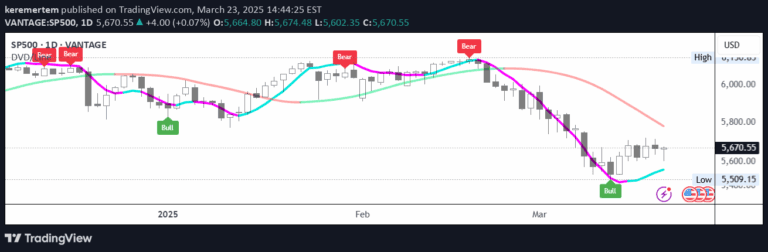
Relative Price Volume identifies trading anomalies by comparing price candle size and volume against historical averages, highlighting potential trend reversals or consolidation periods.
Explore complementary indicator rolesHow it works
The Relative Price Volume indicator calculates average candle body size and volume over a specified period. It uses predefined long and short factors to determine when a candle or volume deviates significantly from the historical average.
When a candle is substantially larger than average but volume is lower, or when a candle is smaller than average but volume is higher, the indicator marks these as potential anomalies. These anomalies are signaled with a cross on the chart, indicating a possible momentum shift or impending price consolidation.
Why it may be useful
By revealing discrepancies between price movement and trading volume, this indicator helps traders identify potential market turning points. It provides insights into the underlying strength or weakness of a current price trend by highlighting when price actions might not align with typical volume patterns.
The signal is particularly valuable because it can reveal hidden market dynamics that might not be immediately apparent from price action alone. Traders can use these anomalies to anticipate potential trend reversals, prepare for consolidation periods, or identify moments when market sentiment might be changing.
When to explore it
The Relative Price Volume indicator works best in markets with consistent trading activity and clear volume patterns. It is most effective when used in conjunction with other technical analysis tools like support and resistance levels, trend indicators, or momentum oscillators.
Traders should apply this signal across different timeframes, from short-term scalping to longer-term swing trading. It is particularly useful during periods of market transition, when price movements might be uncertain and volume can provide additional context about potential trend changes.
Keep exploring
What we’ve verified
Access, alerts and repainting behaviour have not been independently verified for this indicator. Check the creator’s current publication and settings.
General descriptions and classifications are recovered research. Verified details above identify the specific checks we have completed. Check the creator’s current publication for later changes.