
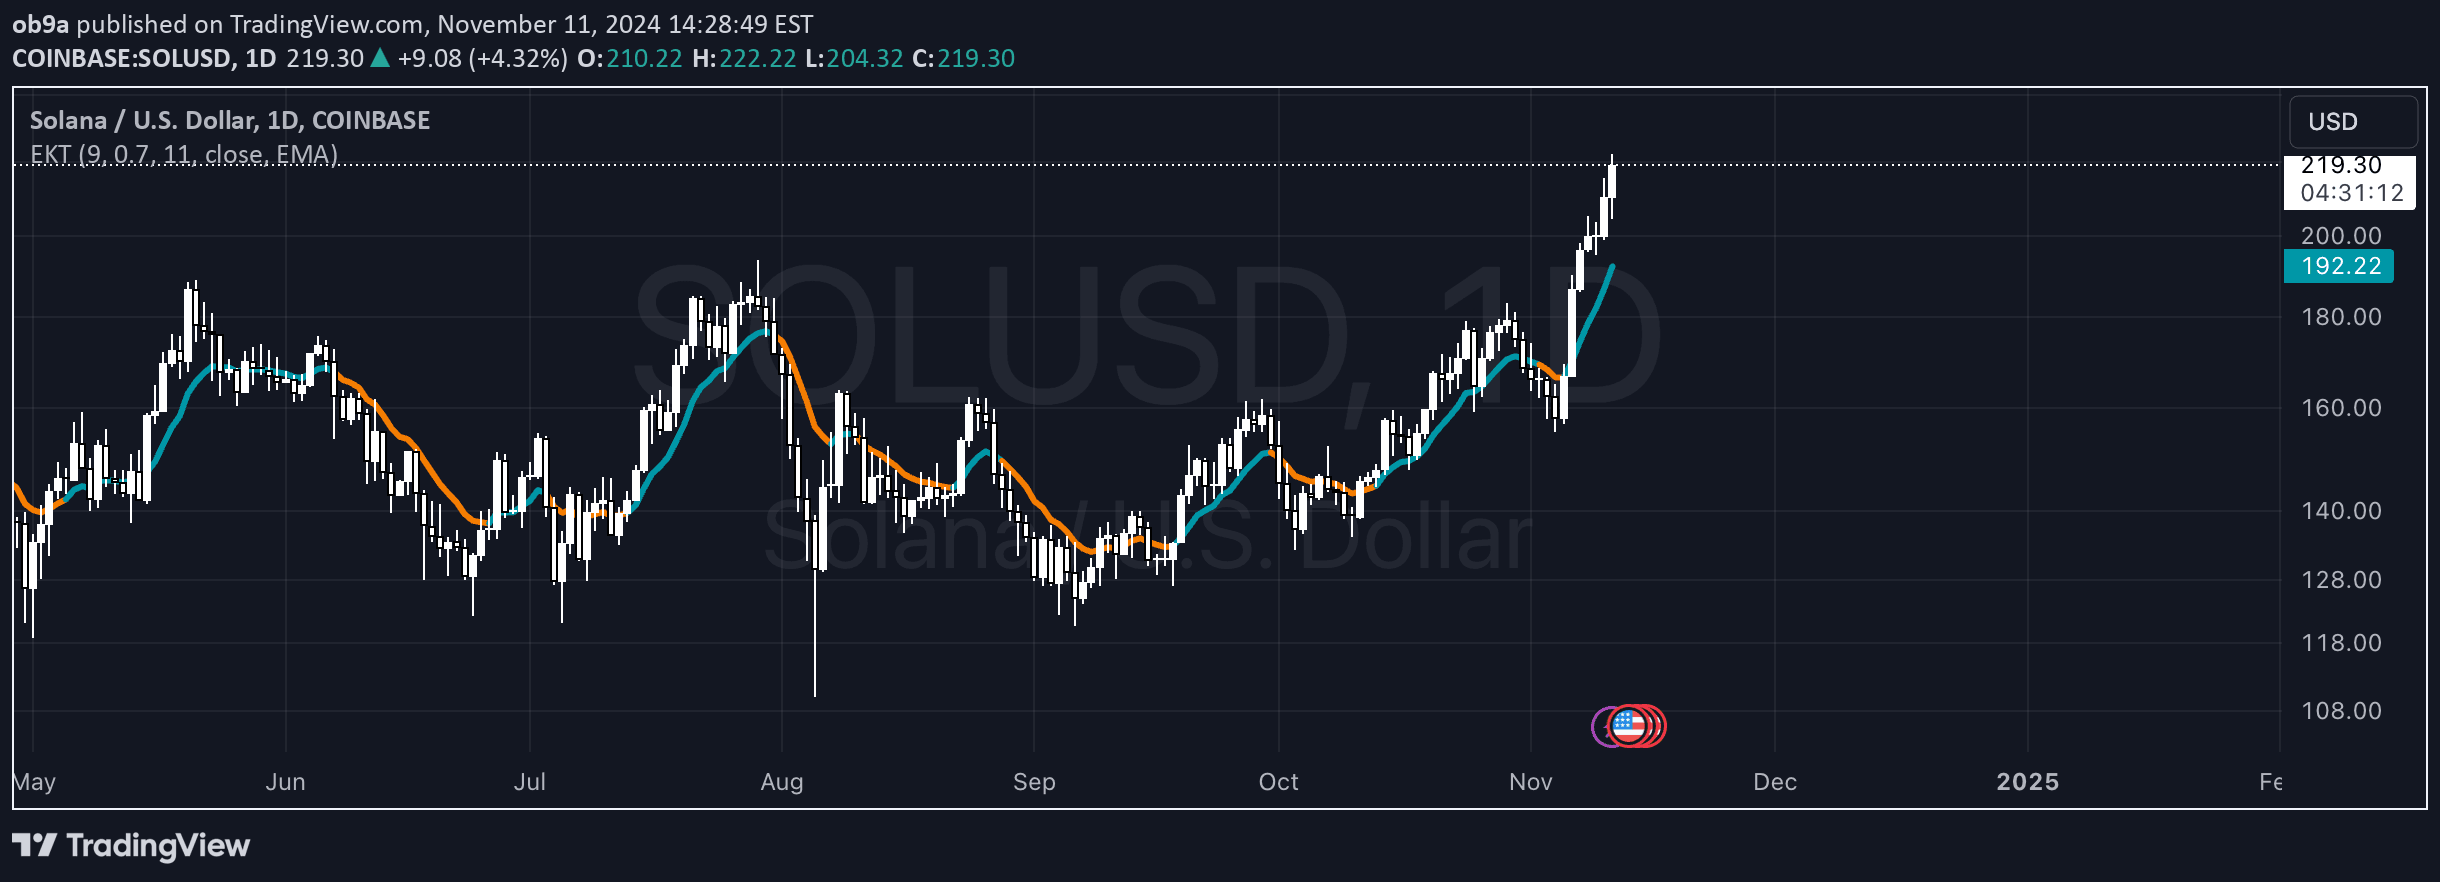
An advanced Keltner Channel indicator that uses customizable volatility measures and moving averages to identify market trends and potential price momentum shifts.
Explore complementary indicator rolesHow it works
The Enhanced Keltner Trend (EKT) indicator calculates a central moving average line with dynamic upper and lower bands based on market volatility. Users can choose between two volatility measurement methods: Average True Range (ATR) or price range width, allowing for flexible channel calculations.
The indicator creates trend signals by analyzing price movement relative to these bands. When price crosses above the upper band, it generates a bullish trend signal, and when price crosses below the lower band, it indicates a bearish trend, providing clear visual cues for potential market direction.
Why it may be useful
The Enhanced Keltner Trend offers traders a sophisticated tool for understanding market dynamics by combining trend identification with volatility analysis. Its customizable parameters allow traders to adapt the indicator to different market conditions, making it a versatile approach to trend detection and momentum assessment.
By providing configurable settings for moving average type, period, and volatility calculation, the indicator empowers traders to fine-tune their analysis and potentially improve their trading decisions across various financial instruments and timeframes.
When to explore it
The Enhanced Keltner Trend is most effective in markets with clear trending characteristics, where price movement shows consistent directional momentum. It performs exceptionally well in liquid markets with sufficient price volatility, such as major forex pairs, stock indices, and actively traded commodities.
Traders should use this indicator in combination with other technical analysis tools to confirm signals and reduce false positives. It is particularly useful during periods of sustained market trends, helping traders identify potential entry and exit points with greater precision.
Keep exploring
What we’ve verified
Access, alerts and repainting behaviour have not been independently verified for this indicator. Check the creator’s current publication and settings.
General descriptions and classifications are recovered research. Verified details above identify the specific checks we have completed. Check the creator’s current publication for later changes.


