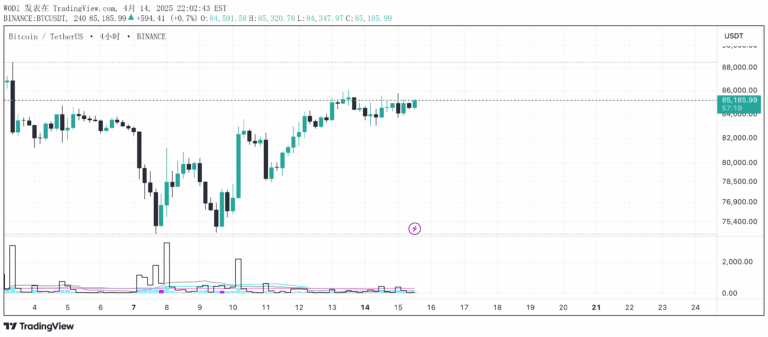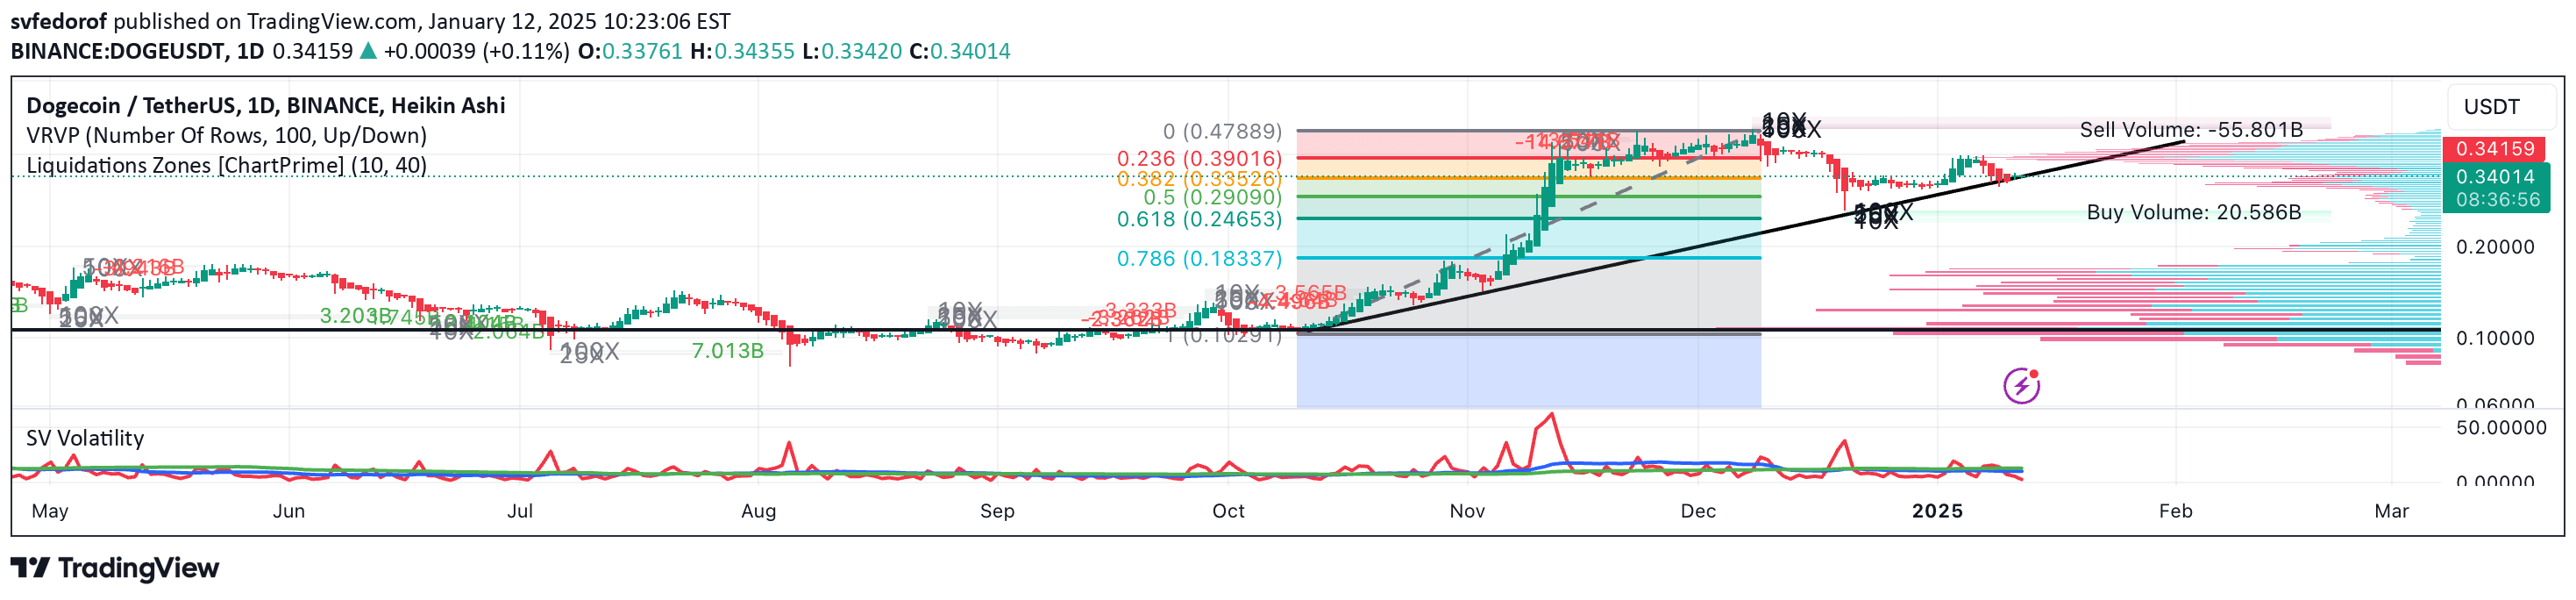
The SV Volatility Indicator measures daily market price fluctuations through three lines representing daily, 30-day, and 90-day volatility averages.
Explore complementary indicator rolesHow it works
The indicator calculates daily volatility by computing the percentage difference between high and low prices relative to the closing price. This raw daily volatility measurement provides an immediate snapshot of price movement intensity.
The indicator then applies simple moving averages to smooth out these daily volatility readings, creating two additional lines. A 30-day moving average helps reduce short-term fluctuations, while a 90-day moving average offers a broader perspective on longer-term volatility trends.
Why it may be useful
Volatility indicators help traders understand market dynamics by revealing the magnitude and consistency of price movements. By quantifying price fluctuations, traders can assess market uncertainty and potential risk levels more effectively.
The multi-line approach allows traders to compare immediate daily volatility with smoothed 30-day and 90-day trends, providing a comprehensive view of market behavior. This comprehensive analysis helps traders make more informed decisions about potential market entry and exit points.
When to explore it
The SV Volatility Indicator is most effective during periods of market transition or uncertainty when price movements become less predictable. Traders can use this tool to identify potential breakout scenarios or periods of increased market activity.
It is particularly useful when comparing volatility across different timeframes, helping traders distinguish between short-term price noise and more significant market trends. The indicator can be especially valuable during earnings reports, economic announcements, or other events likely to impact market volatility.
Keep exploring
What we’ve verified
Access, alerts and repainting behaviour have not been independently verified for this indicator. Check the creator’s current publication and settings.
General descriptions and classifications are recovered research. Verified details above identify the specific checks we have completed. Check the creator’s current publication for later changes.