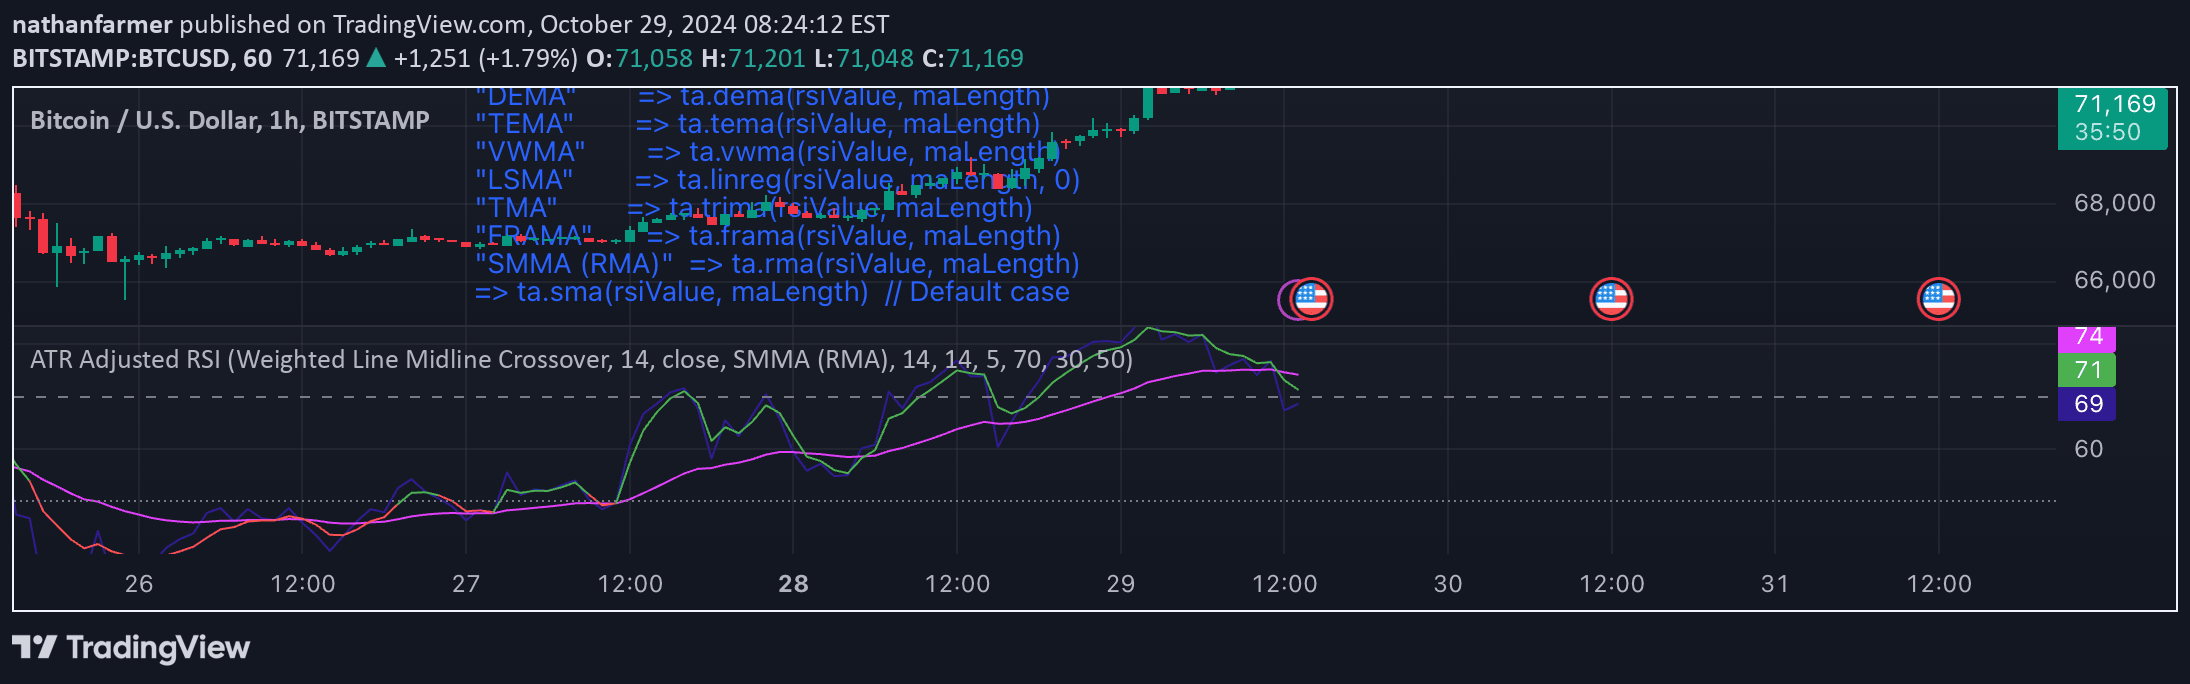
A smoothed RSI-based trend filter using median price smoothing and standard deviation bands to identify market conditions and potential trend reversals.
Explore complementary indicator rolesHow it works
The indicator begins by smoothing price data using a median filter, which helps reduce noise and eliminate extreme price fluctuations. After smoothing, it calculates the Relative Strength Index (RSI) on the filtered price, providing a more stable momentum measurement.
The RSI is then further smoothed using a customizable moving average like DEMA or EMA, which enhances the signal's responsiveness. Standard deviation bands are applied around this smoothed RSI, creating dynamic upper and lower thresholds that help traders identify potential trend changes and market conditions.
Why it may be useful
This advanced RSI-based indicator offers traders a more refined and nuanced approach to analyzing market momentum and trend strength. By incorporating multiple smoothing techniques, it reduces false signals and provides a more reliable view of potential market movements.
The combination of median price filtering, customizable moving averages, and standard deviation bands allows traders to adapt the indicator to different market conditions and trading styles, making it a versatile tool for identifying potential entry and exit points.
When to explore it
The indicator is most effective in markets with clear trending characteristics, where momentum shifts are significant and predictable. It performs well across multiple timeframes, making it suitable for scalpers, day traders, and swing traders seeking a comprehensive trend analysis tool.
Traders should use this signal in conjunction with other technical indicators to confirm signals and reduce the risk of false predictions. It is particularly useful during periods of moderate market volatility where trend identification can provide a strategic advantage.
Keep exploring
What we’ve verified
Access, alerts and repainting behaviour have not been independently verified for this indicator. Check the creator’s current publication and settings.
General descriptions and classifications are recovered research. Verified details above identify the specific checks we have completed. Check the creator’s current publication for later changes.