
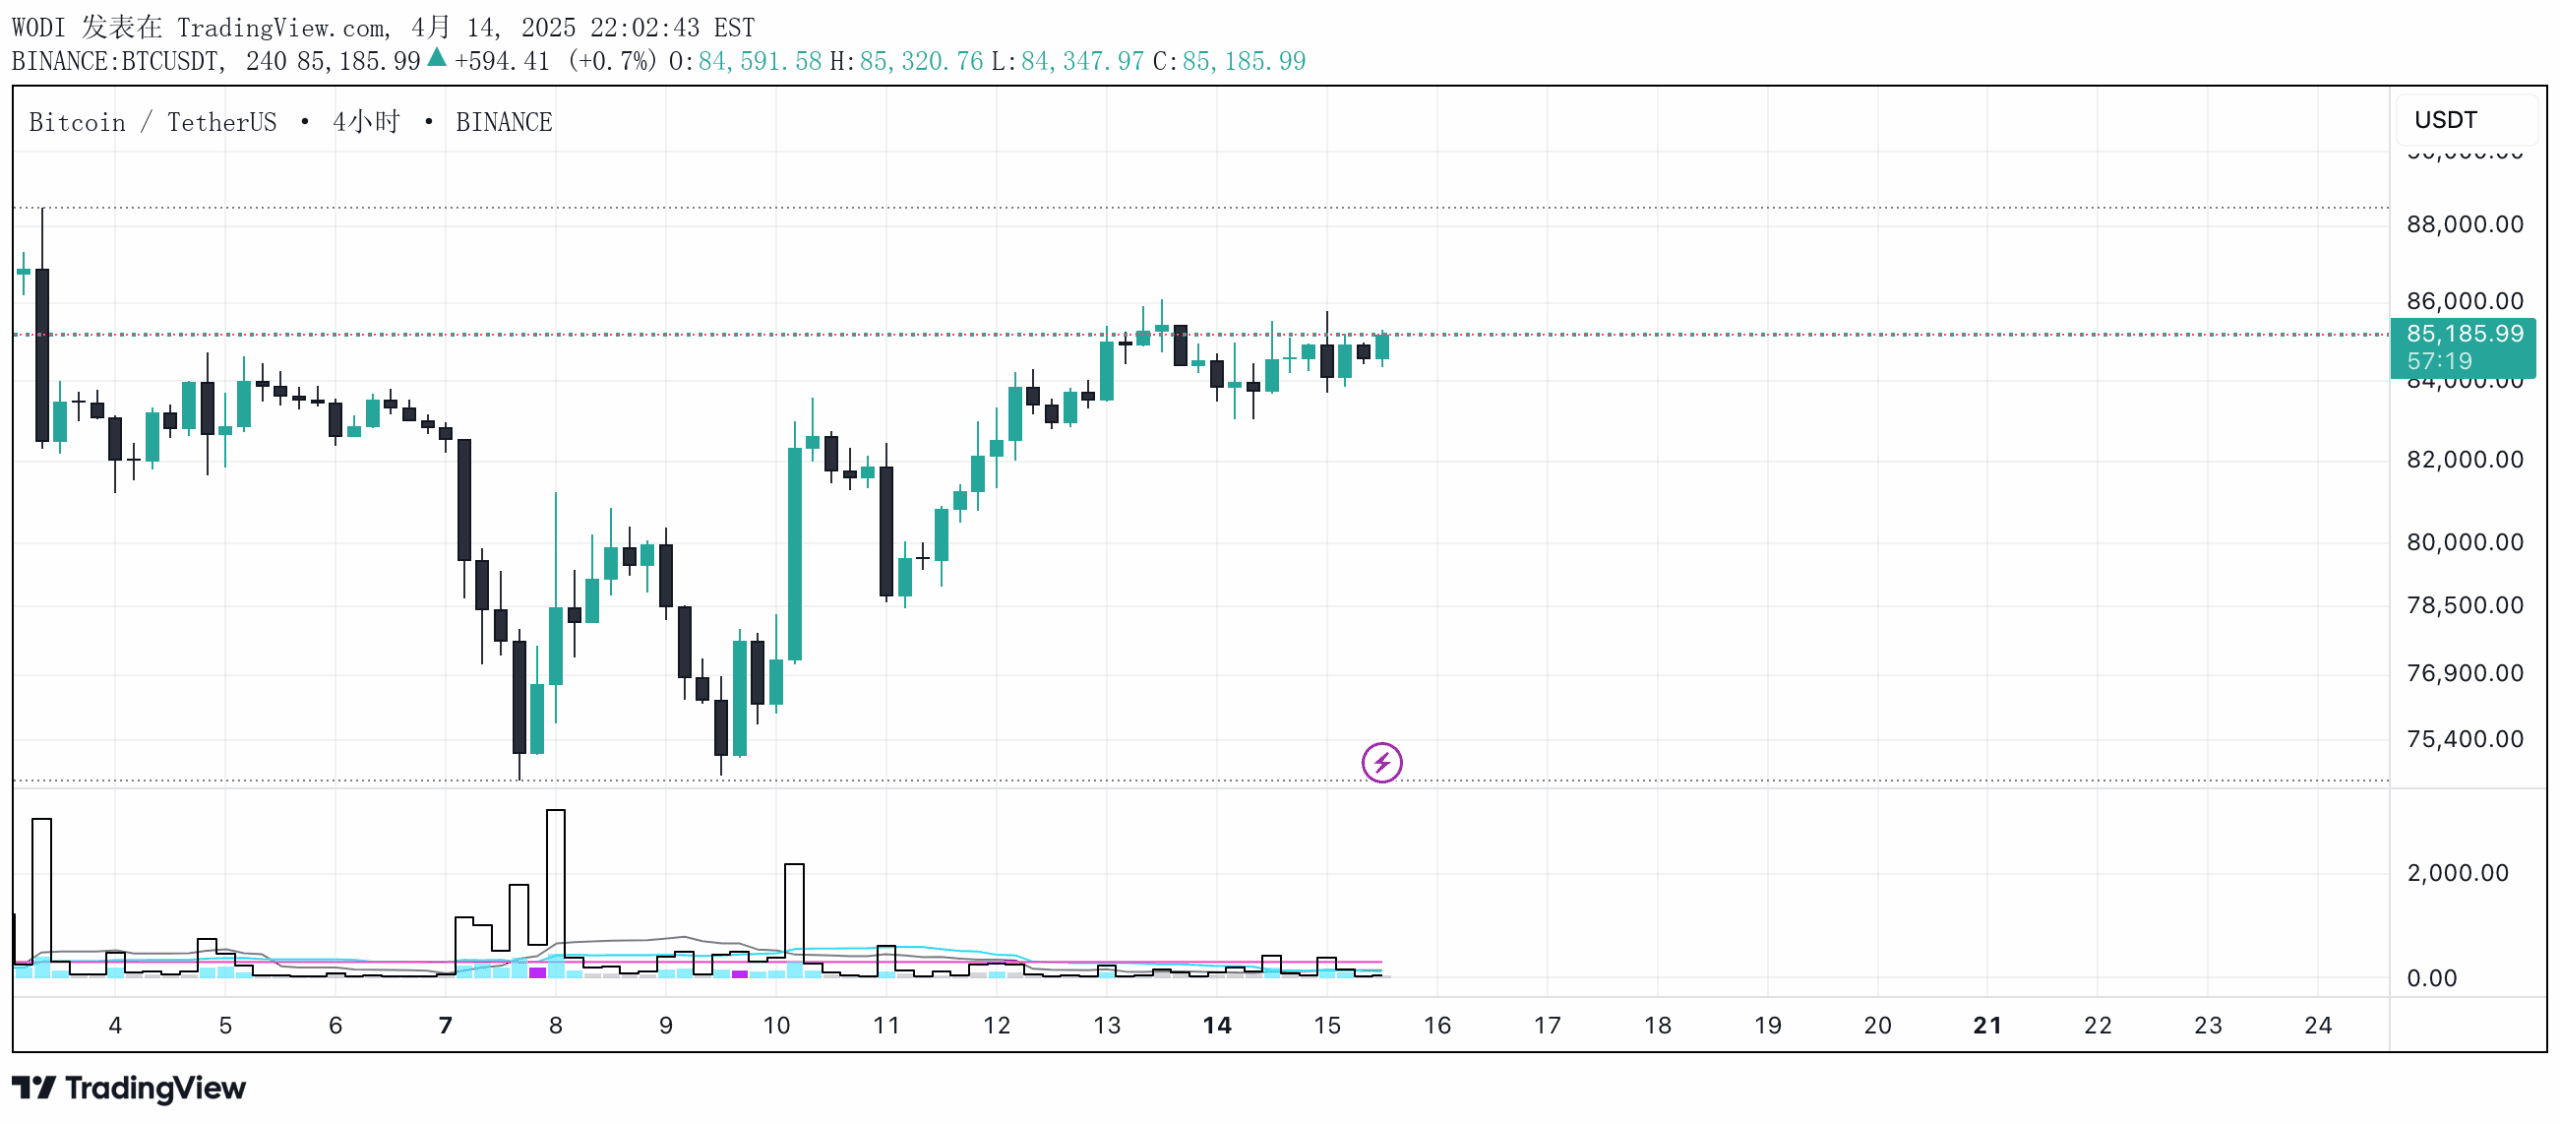
A composite index measuring market activity by combining trading volume and price volatility to identify potential trend reversals and market anomalies.
Explore complementary indicator rolesHow it works
The WODI indicator calculates a unique index by multiplying volume percentage with price volatility, creating a comprehensive market activity metric. It uses custom parameters like volume moving average length, index moving average lengths, and sensitivity multipliers to adapt to different market conditions.
The indicator then computes short-term and long-term moving averages of this index, generating a threshold level to filter market noise. By analyzing recent price bars and examining specific conditions related to volume, volatility, and price movements, it can detect potential reversal patterns and market shifts.
Why it may be useful
This indicator provides traders with a nuanced view of market dynamics by simultaneously tracking trading volume and price volatility. It helps identify potential market turning points by revealing underlying activity that might not be apparent from price action alone, offering insights into market sentiment and potential trend reversals.
By combining multiple market factors into a single composite index, the WODI offers a more comprehensive analysis tool. Traders can use this to validate trends, detect potential anomalies, and make more informed trading decisions across different market conditions and timeframes.
When to explore it
The WODI indicator works best in markets with significant price movements and varying trading volumes, such as stock indices, forex, and cryptocurrency markets. It is particularly effective during periods of market uncertainty, where traditional price-based indicators might not capture the full market dynamics.
Traders should use this indicator in conjunction with other technical analysis tools to confirm signals and reduce false positives. It is most valuable during trending and volatile market conditions, where its multi-dimensional approach can help identify potential trend reversals and market shifts.
Keep exploring
What we’ve verified
Access, alerts and repainting behaviour have not been independently verified for this indicator. Check the creator’s current publication and settings.
General descriptions and classifications are recovered research. Verified details above identify the specific checks we have completed. Check the creator’s current publication for later changes.


