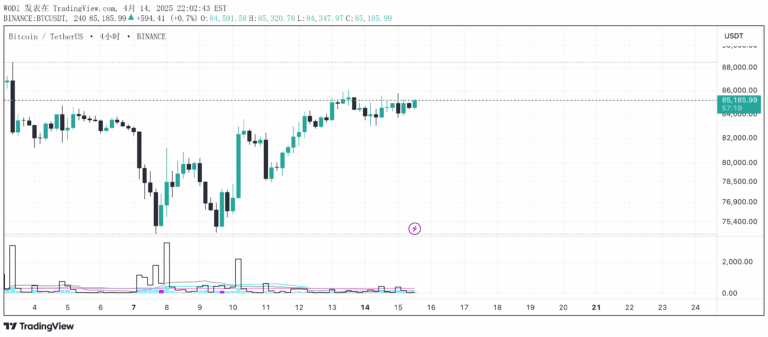
A volume volatility indicator that analyzes trading volume dynamics, comparing volume on up and down days to reveal market sentiment and potential trend strength.
Explore complementary indicator rolesHow it works
The Volume Volatility Indicator operates by tracking volume fluctuations across different market conditions. It calculates volume volatility by comparing current volume to its moving average, creating a blue line that represents market trading intensity.
The indicator simultaneously tracks multiple volume metrics, including average volume on up and down days, and generates a delta percentage line. This line compares volume strength between bullish and bearish periods, providing a comprehensive view of market participation and potential directional momentum.
Why it may be useful
This indicator helps traders understand market dynamics by revealing hidden volume patterns that might not be immediately apparent from price action alone. It provides insights into market sentiment, showing whether buying or selling pressure is dominant in current trading conditions.
By quantifying volume volatility and comparing volume across different market states, traders can gain a more nuanced understanding of potential trend strength and market participation. The multi-dimensional approach allows for more informed decision-making by highlighting subtle shifts in trading volume.
When to explore it
The Volume Volatility Indicator is most effective during periods of significant market movement or potential trend changes. It works exceptionally well when used in conjunction with other technical analysis tools to confirm potential trading signals and assess market sentiment.
Traders should pay special attention to this indicator during breakouts, trend reversals, and periods of increased market uncertainty. The delta percentage and volume volatility lines can provide early warning signs of potential trend shifts or confirm existing market momentum.
Keep exploring
What we’ve verified
Access, alerts and repainting behaviour have not been independently verified for this indicator. Check the creator’s current publication and settings.
General descriptions and classifications are recovered research. Verified details above identify the specific checks we have completed. Check the creator’s current publication for later changes.