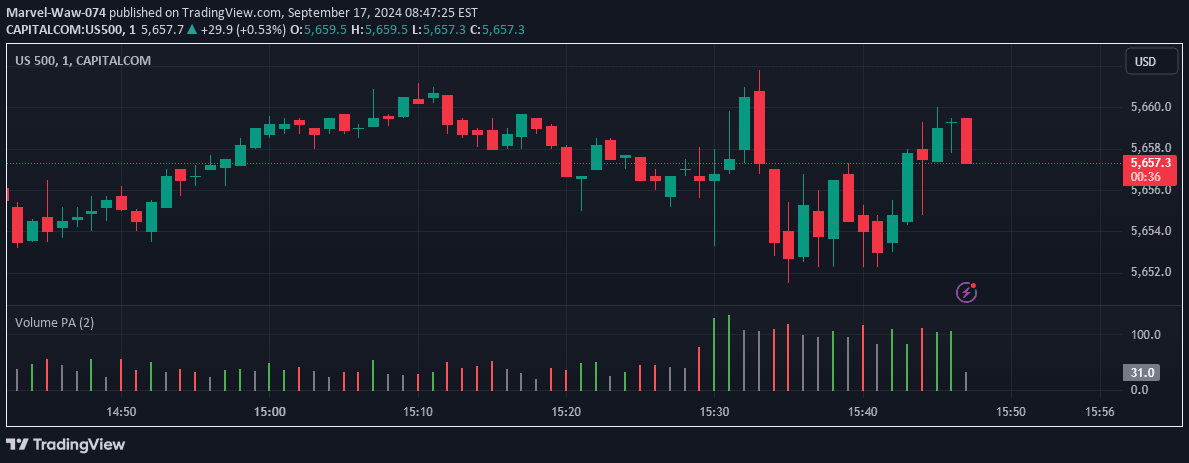
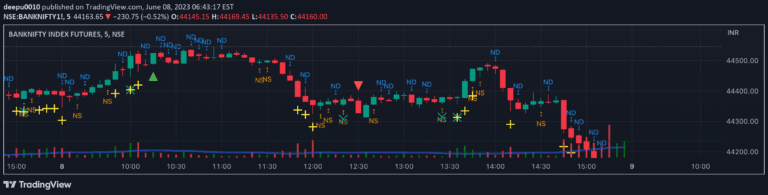
A volume pattern indicator identifying four major trading volume configurations that predict potential price movements by analyzing historical returns and generating predictive targets.
Explore complementary indicator rolesHow it works
The indicator analyzes volume patterns by examining historical price data over a configurable training length, typically 500 bars. It identifies four key volume patterns: bullish breakout, bearish breakout, domes, and inverted domes. By calculating average returns associated with each pattern, the indicator generates predictive targets.
The tool uses sophisticated algorithms to assess pattern sentiment, adjusting for market volatility and current price context. Users can customize the training length and look-forward period to suit their specific trading strategy and timeframe preferences
Why it may be useful
Volume pattern analysis provides traders with critical insights into market sentiment and potential price movements. By quantifying historical returns for specific volume configurations, traders can make more informed decisions about market entry and exit points.
The indicator's ability to dynamically calculate targets based on current market conditions offers a data-driven approach to trading. Understanding volume patterns helps traders identify potential trend reversals, confirm price movements, and develop more strategic trading approaches
When to explore it
This volume pattern indicator is most effective during periods of significant market movement and clear volume trends. It works best for traders seeking to understand underlying market dynamics beyond price action. Swing traders and day traders can benefit from its predictive capabilities across different timeframes.
The tool is particularly useful when markets show distinct volume pattern characteristics, such as breakouts or consolidation periods. Traders should combine this indicator with other technical analysis tools for comprehensive market assessment
Keep exploring
What we’ve verified
Access, alerts and repainting behaviour have not been independently verified for this indicator. Check the creator’s current publication and settings.
General descriptions and classifications are recovered research. Verified details above identify the specific checks we have completed. Check the creator’s current publication for later changes.